Showing posts with label basketball. Show all posts

Monday, August 16, 2010

The Anatomy of a Block: Points Created (Part 5)

In case you missed it, check out Parts 1, 2, 3, and 4 in this series on "The Anatomy of a Block": Introduction, By Shot Location, By Shot Type, and Repeatable Skill.

This is a long post coming up, but I hope you try to read it to the end, as I believe I uncovered the most interesting findings so far in this study. I mentioned last post that I would be doing a summary of my findings and concluding with improvements and possible future study ideas on the value of a block. Turns out that there is a lot more to work on and a lot more ahead, but for the time being, this will be the last post in this series on "The Anatomy of a Block," which will almost certainly be re-continued sometime in the future.

It's amazing what social media and the strong online basketball community has been able to help me with in terms of understanding the merits of this study, but much more so the limitations and areas for improvement. In the end, I believe the analysis on the value of blocks based on shot location and shot type may be worth it, but that it is limited in assessing the defensive value of players, and even assessing the value of a block itself. There are a host of other factors that go into determining the quantitative value of a block and its effects on the game, not just shot location and shot type. I suppose this is a consequence of every area of research, in that an examination of one part of the analysis will never be complete and always has room for improvement.

Before I go into the other components to take into account when evaluating the value of a block, let me first address a few problems from my previous posts, thanks to the critical evaluations of readers. My initial idea of assigning a number to a block based on shot location and shot type eventually came up with an average value of a block for each shot-blocker, and hence, my main analysis revolved around measures in the units of PPS (points per shot). To recall, I looked at points saved per block by shot location and points saved per block by shot type. I did not give credit to the actual quantity of blocks amassed by the Marcus Cambys and the Dwight Howards when discussing the PPS values, and I realize that I should not have neglected it. Even if Dwight Howard does not get as high value per block (based on location or type) as Amare Stoudemire (both with over 10,000 minutes played since 2007), it would be misguided to suggest that Stoudemire was more valuable from the shot-blocking perspective than Howard when Howard's 791 blocks since 2007 (2.43 per game) is much greater than Stoudemire's 413 blocks (1.40 per game).

Here's a tabular reproduction of the top 25 shot-blockers in total blocks since 2007 with additional columns of points saved per 36 minutes played for shot location and shot type as well as a look at the top and bottom shot-blockers in that category (minimum of 200 blocks and 1.00 blocks per game since 2007):

https://blogger.googleusercontent.com/img/b/R29vZ2xl/AVvXsEgi6xGvftDSAWz6K7L2enetxzrP4bVP-51v5Uq6Bu2qVfeBlF8tt6Sf59H1xIjPuJz-3rH78BmLK2kQPfkvNVvBM3cfnHtu-klvHD_a38Rot_nJJRjL_vriq1Tp9Sb9kR2laD4FtF8yMNw1/s1600/anatomy5_1.png

https://blogger.googleusercontent.com/img/b/R29vZ2xl/AVvXsEjrWlnKxPBBw0xvhGzRQw7a-ALF57qp3dhdMuuY6jTDIqGEbo15xmmTUZWBqrotv7aVO9jT7lDETrogjtgtBbMYW4gU1iXtrYHqDU3aKSJ_32HoLnHwch1WFgSdrUBHRxbJtqIXVeLlqNyq/s1600/anatomy5_2.png

https://blogger.googleusercontent.com/img/b/R29vZ2xl/AVvXsEhurmZQAucVrHaFxQzXy9quITRHsk-EbnuDICUtnO1dSyds5k8drJGsyY-yAyTnneiqnOXgQe7fo7dNrI_Qnu_Lcku8H5fvlxnaukCHGW3CnM72AsVTI9W5nDOyAFJZAw4fJeLE1P9Bmtxr/s1600/anatomy5_3.png

I sorted by shot location in the top and bottom points saved per 36 MP because it's generally the same as by shot type (and also because I found R2 values of 0.40 and 0.18 respectively for season-by-season fluctuations, meaning that shot location seems like the more reliable measurement for points saved by block). Factoring in the total number of blocks given the amount of minutes a player plays changes our evaluation of who attains the most value from blocks on a per unit time basis. Marcus Camby is one of the noticeable top shot-blockers in this measurement, as well as Alonzo Mourning and Chris Anderson, two players I talked about in previous posts. Take note that Dwight Howard, despite averaging 2.43 BPG, was 10th in points saved per 36 MP. Looking at the bottom guys, guys like Chris Bosh who had high value per block get penalized for only getting just over 1 block per game, while guys like Pau Gasol, Amare Stoudemire, and Elton Brand post low points saved per 36 MP while averaging around 1.40-1.70 BPG.

Now here's the real meat of this exercise, something I've only touched briefly on previously. To summarize what we've looked at thus far, we tried to figure out the value of a block based on shot location and on shot type, forming a "Points Saved" model. However, there are several problems and possible areas of future research I see:

  • Probability of shot-blocker to commit a shooting foul
  • Probability of shot-blocker to commit a goaltending violation
  • Blocks per block attempt and/or block opportunity
  • Altering a shot without recording a block
  • Keeping a player away from the basket and forcing tough shots

The first two are definitely possible to take into account for each shot-blocker. The last three, however, must be noted when using the shot location and shot type models in this series. Some players may block low percentage shots precisely because it is better to force a tough shot in the first place. This includes forcing the shooter to take a shot out of position as well as altering the shot type (turning an open jump shot into a fade away, or turning an easy layup into a reverse layup).

Ideally, the numbers presented in this series should be taken with a grain of salt, and combined with what you see when you scout video with your own eyes. If a defensive player is very good at keeping the guard out of the paint, he is doing his job of forcing the guard to find other opportunities for points rather than taking the high percentage shot. And if the guard goes up for a difficult shot, and the player blocks it, this is the preferred defensive strategy than to block a high percentage shot, even though he is penalized by the shot location and shot type models.

The other side of blocks that I mentioned in the introduction of this series (and also a part of John Huizinga and Sandy Weil's work) is the "points created" part, which is the effect of a block on the shot-blocker's own team's expected points during the next possession. This part may be perhaps the most valuable side of a block that I haven't accounted for, in that blocks that lead to turnovers and create fastbreak points from transition baskets (known as "Russells") are more valuable than blocks that end up back in the offense's hands. Probably the part of the points created side that affects the value of blocks the most because of both its per block value and its total value is number of changes in possession, or possessions gained.

I'd like to take a preliminary look at points created by looking at who has possession after a block. The way I see it, the immediate post-block situation after any blocked shot falls into three categories in terms of possessions:

  • Possessions gained by the defense (the shot-blocker's team)
  • Possessions recovered by the offense
  • Jump ball

If we consider that possessions gained as one possession, no change in possession as zero, and a jump ball as 0.5 possessions (50% chance for either team to get possession on a jump ball), we can formulate the average possessions gained per shot-blocker and per block.

Let's look at the top 25 block totalers as well as the top 15 and bottom 15 shot-blockers in possessions gained per block between 2007-2010, along with their season values to see if these numbers are consistent (consider that 57% is the average possessions gained per block):

https://blogger.googleusercontent.com/img/b/R29vZ2xl/AVvXsEjAM9ryPIPlzCdIhmCMDBEUyjwJQOgSwK3IL-Jv3ol0AXSvM4xp7anjprOBm9XkU0RLl7PqW0JKOMjV4fPy4WCpdGrwGSXJKD2s3BiUdZ3HlCipp-t5PQq-qpqFsptXvi26aJqQdZCXBWFk/s1600/anatomy5_4.png

https://blogger.googleusercontent.com/img/b/R29vZ2xl/AVvXsEiY3Idz0YVSryq_iWgslurHFa02RnLbhXyrqn1WaysdqzdeTkhptBPBZFh4icW0wkCNW18XjB837zOnlBGB95BGVt71vXxVbEXCeJ7zoWb2gdcmgFViTs0ozAncUxxSWIjqvE3-NgVNA8gc/s1600/anatomy5_5.png

https://blogger.googleusercontent.com/img/b/R29vZ2xl/AVvXsEhcOyBSoV5WqvDOQx03BwQ1CxAMTuFLehGuDVESrUBksns3JZzLyjRHbnxnkYQavmQYKFY1K65hcPdOYE_z0cLB5PR0TN89uX99ewgYlx3_NvmIcp-HcNbXdehCcjLpq4G3ZQnJD7v7jo5t/s1600/anatomy5_6.png

https://blogger.googleusercontent.com/img/b/R29vZ2xl/AVvXsEjyjRPxabc3ntEJAKnhr04jnxOXO-pDZR40yEidtBlDnhCo2L-htx7-q5BrTwpUCrPZkeL3UH6w80hjWY9b_DNkl2PAeyvH21nhc-I9c5W-Z5tYLxBRykYkebWwtfZyljnem01w2OBHgapn/s1600/anatomy5_7.png

Lots of revealing stuff going on here. Remember how I touted Chris Anderson for his points saved per block numbers? Looks like he'd be among those in the bottom of the league for a points created per block model, as his blocks resulted in a possession gained only 51.39% of the time, the worst value since 2007 for the players sampled. Lamar Odom tops it off with 65.84% since 2007, while the best season was Joel Przybilla in 2007 with 70.90%. Andris Biedrins had the worst season with a low value of 42.22% this past season, and was mainly average in his previous three seasons. The other player I noted who performed poorly in the points saved model was Brendan Haywood, and he's among the league leaders in possessions gained per block with 61.89% (again, compare this with the league average of 57%).

Finally, how do we combine the points saved model (using shot location and ignoring shot type) with the points created model, which is in the form of possessions gained? Using the league points per possession values for each season between 2007 and 2010, I calculated points created for each possession gained, then added it to the points saved. Let's take a look at some of these numbers since 2007 (minimum of 200 total blocks and 1.00 blocks per game since 2007):

https://blogger.googleusercontent.com/img/b/R29vZ2xl/AVvXsEgT6s_2iORWYh02w5kA6k-Kk6wgKvzLqGHTWC8bNiZXCqywf-T0ZCYeCycZ1OOakDnYedGfKip_KdQgglKcbcqGZaqM5bsSxInD3LH8hKMVaytExjZ_USJrGeg1mLtbEVOjmBcZ2nSDyINl/s1600/anatomy5_8.png

https://blogger.googleusercontent.com/img/b/R29vZ2xl/AVvXsEi3-oPCsuBsnom0TnjkGQGkY0NmjTQ8L5hu7Hje2iJYuc1Mxw1d5zJ9ShVwlWfhv2Xm8kIqb1dNil6_Eq43uvwVQdCQT_0-YBzKZt4mdutR10qRShR7VEzOzZgj-7hH0tN56TAj_rxSMz0t/s1600/anatomy5_9.png

https://blogger.googleusercontent.com/img/b/R29vZ2xl/AVvXsEiA30ankleCkd54YSaTXumzRHPlkWhxHQQRCxKTFcEUGlbTiuFF74a_b48XIO1UGKNIs5f4pQI5wfrYHs2hBGRTsyKApRi0CaWgqiKmt7QvRalxvhEdBbBI6oRHWcaDPtzGra6HwD-L1dSw/s1600/anatomy5_10.png

Alonzo Mourning may be the best shot-blocker in the past 5 years, if not one of the best in our generation as his blocks are worth 6.528 points per 36 minutes played. Even though he averaged less blocks per game (2.16 BPG) in this last two seasons, he beat Marcus Camby (2.79 BPG) by over 1.5 points per 36 MP (6.528 pts/36MP vs. 4.920 pts/36MP). Chris Anderson is second, who more than makes up for his low possessions gained per block with 2.12 blocks per game, reaching a block value of 6.138 points per 36 MP. Guys like Joel Anthony and Ronny Turiaf also have high block value given their minutes. For the players sampled, the lowest points saved and points created yields players like Chris Bosh, Kevin Garnett, Amare Stoudemire, and Pau Gasol, players who averaged total block values less than 2.5 points per 36 MP since 2007.

This is my longest post yet in this series, but if you made it this far, I'm glad that you did and I hope you enjoyed what I found. I believe that this is only the starting point to analyze the value of blocks better, and this at least provides more information than total blocks or blocks per game in determining who are the best shot-blockers in the NBA. One thing of note is that I found very little season-by-season correlation in the possessions gained stat, which indicates that points created from blocks may fluctuate too greatly from year to year to be attributed fully to a player's shot-blocking skill. Still, these numbers can help us understand the value of blocks from past seasons better. I would still like to reiterate that numbers in measuring block value are not enough, and that they should be evaluated in conjunction with professional video scouting, especially in a dynamic team game like basketball where defense is many things other than blocks.

That's it for this series on the value of a blocked shot, at least, for the time being. If there is something you like (or didn't like), I welcome you to leave a comment or two. I'd like to put this project to rest (or on hold) for awhile, as there are other things in sports that I would like to write about. Nevertheless, I hope you enjoyed this series as much as I have.


Friday, August 13, 2010

The Anatomy of a Block: Repeatable Skill? (Part 4)

In case you missed it, check out Parts 1, 2, and 3 in this series on "The Anatomy of a Block": Introduction, By Shot Location, and By Shot Type.

In this post, I'll take a look at whether or not value of blocks as measured by shot location and value by shot type is a repeatable skill. The premise is that if a skill in sports is measured effectively, then there should be reasonable expectations that the statistic measuring the skill will remain consistent from year to year, making the skill repeatable. One of the tests of the value of a statistic in objective evaluation is looking at how much that statistic varies with time for each player. Essentially, if a set of numbers fluctuates from year to year for not just one but most players, then that provides evidence that a certain skill (such as blocking certain shots based on location or type) may not be repeatable. This type of analysis looking at the correlation between what a player does one year with what a player does the next year is used in preliminary studies before determining the existence of the hot hand, clutch hitting in baseball, and how much control a pitcher has over the number of hits he allows.

Here's a look at the block value by shot location of the top 25 shot-blockers in total blocks since 2007 along with their season-by-season values to see if they fluctuate:

https://blogger.googleusercontent.com/img/b/R29vZ2xl/AVvXsEiRGHlZOdqtkytSsZZCRxYBeek9CjR06hBuzifsFMPen2mV1n14dW6le1r-pn2sgd0rHAE6tzcUB_IQThXIwPG0nq4lk5tSBX8MwFUAB6GMuz3-4vNO2-fDa_bASJgi4WJOVhuVrCORj7hJ/s1600/anatomy4_1.png

The color scale of the cells should give you an idea of how much points saved per block by shot location vary from season to season for these 25 players. For instance, if you look at the '2007' column and the '2010' column from left to right, you can see the colors of the cells change or stay the same, particularly for players with high value blocks such as Andrew Bogut, Emeka Okafor, and Josh Smith as well as players with low value blocks such as Andris Biedrins and Brendan Haywood. You can also notice some players with a little bit higher statistical fluctuation in their season-by-season value per block numbers, such as Ronny Turiaf. The standard deviation column on the far right is a measure of how spread out these numbers are, and captures a sense of how much the numbers fluctuate. A further discussion on the validity of this measurement gets into a statistical discourse covering other stats terms that I won't get into right now, but for the most part, these standard deviation values are relatively small and speak that the data is uniform from season to season (more likely that blocking shots based on location is a repeatable skill) more than it is volatile (less likely that the numbers are affected too greatly by random fluctuations).

Now here's a look at the block value by shot type of the same top 25 shot-blockers in total blocks since 2007 with their season-by-season values:

https://blogger.googleusercontent.com/img/b/R29vZ2xl/AVvXsEgBvTtJGSbcjdeKB7trgNetG7kFhbhGDJzmRLudfeqWK2FwVL21GWjAKX1uFPGHaAo_I4fZR6ABUNlbaTZ2lhpFOO4amAjtJAZ9VcueqAoWcvEpBBUk3nNmrEwsnZb-dqE7iAGG0v1su2Nd/s1600/anatomy4_2.png

Again, the color scale of 2007, 2008, 2009, and 2010 shows mostly consistency from left to right, save for a few players. This time, Jermaine O'Neal has the most fluctuations in his values by season, ranging from 0.903 PPS in 2009 to 1.102 PPS in 2007. Other than O'Neal, however, it seems to me that shot-blockers with high value per block tend to have high values for all four seasons, and vice versa with shot-blockers with low values. Brendan Haywood did attain a 1.011 PPS by shot type in 2007, but followed that with some of the lowest PPS numbers with 0.839 in 2008 and 0.847 in 2009.

All of this brings me into another thought about whether or not block value by shot location is correlated with block value by shot type. Let's look at a scatter plot of value by shot location against value by shot type using all 122 players I sampled:

https://blogger.googleusercontent.com/img/b/R29vZ2xl/AVvXsEjo2VbykBQjpPfr7TUNsj6UzVRBbP3wQD78YmJ6j17DOCMbMIXldg0jr2MKK-KBS7yl8UqIBk6Xjsa9edNcvX94jMdyDaqlYUzjOp0Yc2T1b-ClIlCuQ69OOrL632g3sx1MkXJChyphenhyphenhgp_Vm/s1600/anatomy4_3.png

R2 value of 0.3952 is decent, which is a measure of how correlated the two sets of data are, ranging from 0 to 1 where 0 is completely unrelated. However, shot location and shot type may speak to different types of blocks and skills needed in order to attain those blocks, even if different shot types are precisely defined by where they are taken on the court (all dunks and layups are at rim and 3-pointers are at a distance, for instance). Also, I believe a more intrinsic evaluation on the interaction effects between types of shots and where they are on the court would need to be conducted in order to properly assess how the block value models affect one another and combine both models.

I'm sure many of you think a lot of this is just statistical blabber jabber, and I do too, so I'll just leave it at that for part 4. In my next and last post on this rather long series, I will be concluding with a summary (in words, not tables and charts and numbers) on what I found and detailing an exhaustive list I have compiled on the limitations of the study on blocks as well as possible future improvements and extensions. I hope to be getting back to doing more posts on what I've been working on with shot location heat maps, baseball PITCHf/x, and football play-by-play data, so in a sense, I'm rushing along to get this series done ;).

Wednesday, August 11, 2010

The Anatomy of a Block: By Shot Type (Part 3)

In case you missed it, check out Parts 1 and 2 in this series on "The Anatomy of a Block": Introduction and By Shot Location.

In this post, I'll take a look at the value of a blocked shot based on the shot type. The first thing to figure out is what type of shot types are recorded in the PbP dataset provided by Basketball Geek (I really can't stress enough how thankful I am that Ryan J. Parker provided this data). I grouped every shot with a recorded shot type from the 2007-2010 seasons and found the number of shots taken as well as the total points scored in order to figure out points per shot by shot type (there are 63 different types of shots in the PbP data). Let's look at several lists of shot types: 1) Most shots taken, 2) Highest points per shot, and 3) Lowest points per shot.

https://blogger.googleusercontent.com/img/b/R29vZ2xl/AVvXsEj3cdhT-zuOKmBfTJHRi3MuMsyeKWwt5u4GN1GFDNq4EInXLblrXtfUVEWpnzLnzoIs3sPbqTn6AOvsoNiWgTxTnribvqSoNL2VQYyrujHcOAGlwwzVoMoEpKzFYWFuHM6QgOEWXcf2T5D6/s1600/anatomy3_1.png

https://blogger.googleusercontent.com/img/b/R29vZ2xl/AVvXsEi4r9H9OBzL3nJPnF3hUXWTwdgC1wyOppDABOnv41fZSCs4zaR06lIUyo9JLEW5uGg_jTx-5LQxDg2LX1KZTj3tlTYGg_IVq0pQZRrkQ8Wp0VMw4KD-VCDuKrxU6vEmfzNuDxSxljnBPZ6M/s1600/anatomy3_2.png

https://blogger.googleusercontent.com/img/b/R29vZ2xl/AVvXsEgvTTF7KZ-lmi0ZDd1qImn1j4rp5nz6C6bGTYPod2SlEIVAMygkImujvO8K0A_jJKO1Chx1SXu74bpU9fbD9TLyucdXw1aC8yj9cQJhWm1X6D1CYEhvtSoSLDoPVyfeBmYAWX7NLGl1zyzz/s1600/anatomy3_3.png

Big top 15 tables there. I've added effective field goal percentage (eFG%) which is just field goal percentage taking 3-pointers into account (however, I will be talking in terms of PPS rather than eFG% in order to remain consistent throughout this study). Most shots are categorized generically, for example, jump or layup or dunk instead of the more specific like jump bank hook or turnaround finger roll or putback reverse dunk. It's definitely interesting to see how many driving layups and reverse layups are distinguished from the generic layup.

In the second table, clearly dunks and layups of the eclectic variety return the most points per shot, with several thousand slam dunks averaging 1.956 points per shot (note here that an alley oop dunk averaged 1.814 PPS through four seasons of data, so next time your team messes up an alley oop dunk, it's alright to throw a tantrum). In the third table, generic jump shots (0.692 PPS) and hook shots (0.907 PPS) are the least efficient shots by this measure, but it's also important to note that the generic layup (0.914 PPS) is a close third. In addition to the 118,804 generic layups recorded, there are more than 69,000 other categorized layups as well, all of them being high value shots within 1.3-1.7 PPS.

Now let's take a look at which shot types result in or avoid being blocked the most: 1) Most shots blocked, 2) Highest % of shots blocked, and 3) Lowest % of shots blocked:

https://blogger.googleusercontent.com/img/b/R29vZ2xl/AVvXsEh3fgKpdHKfzJGNnV_gwwXPH5SOqDHwr6VXQ9UkQDe7ty8BWv3-LIXk4MuxLeOUFy07p-0eZUMuNEMRILheBPhXBpzpFSvPUABq9Q6sJhsCHZG20VnT8kn1rRy0xLduQxexAuGn16y1yOAL/s1600/anatomy3_4.png

https://blogger.googleusercontent.com/img/b/R29vZ2xl/AVvXsEi-u6Rph_TL7l3bs0dLbvnZyVVIwwwoe-oGseAESLPNHCHuC6GsdPJ-A70bq-KK2SMbLK83Xzo595-ZtI2ZewmkmtWM90pPwGJT_FZzJmbxkrY4YITT66uP7z9gnGulMcDGTPEdRvQOaZly/s1600/anatomy3_5.png

https://blogger.googleusercontent.com/img/b/R29vZ2xl/AVvXsEhl93IEqQ5zJsXWn5zvhpN9w2XOcKBxu0m6YKYNYmBJm76zkGCHNIK3T-AXql-yOuuyM4ggDQGZawvgAx3TKXjQBGWz6W9DQwaEIBeBxRCUbPNpI7aGcc9QojB365PloL3jK59591tjVVV-/s1600/anatomy3_6.png

The second and third tables are the truly interesting ones here. 19.73% of all generic layups were blocked in 2007-2010, while 13.65% of all driving jump shots were blocked. Several other types of layups were also blocked more than 5% of the time. For these driving and reverse layups as well as the generic dunk, having efficient point values ranging from 1.345 PPS to 1.749 PPS are more important numbers than the block percentages. For instance, even though a guard driving in only to get blocked can be infuriating, keep in mind that a successful driving layup attempt goes in 73% of the time even if it is blocked 7.57% of the time (by successful, I mean successfully penetrating the defense up until the shot). Check out the end of this post to see the entire list of shot types.

Now let's go back to the players. Similar to the blocks by shot location post from yesterday, I took the points per shot for each shot type and multiplied that by the number of blocks of a particular shot type for each player. Summing it up, I found the total number of points saved by shot type and the points saved per block. Let's take a look at the top 25 shot-blockers in terms of total blocks since the 2007 season and see how they fared in points saved per block:

https://blogger.googleusercontent.com/img/b/R29vZ2xl/AVvXsEj121NJ7hiXp0cGX7ImhGjsas9c_71wCSi5zzEIxm_gULMPRsOHZk7hZlgLV0VwqiHuaRtFyupowZ1UeWoJgKcLkGxpHzsN-tCycgCavepaOhsJQicxkDTdQkHEIbzfO_SrElRZgRt5bLH4/s1600/anatomy3_7.png

The values for points saved per block by shot type here actually vary more than the values by shot location I looked at yesterday. Here, Josh Smith (1.027 PPS) and Erick Dampier (1.022 PPS) saved the most points per blocked shot based on shot type in this top 25 list, while Andris Biedrins (0.860 PPS) and Brendan Haywood (0.875 PPS) saved the least, just like the table by shot location. Moving along, let's look at both the top 10 and bottom 10 shot-blockers in points saved per blocked shot based on the shot type (minimum of 200 blocks since 2007):

https://blogger.googleusercontent.com/img/b/R29vZ2xl/AVvXsEi0DIJtlkUmCs6Qf13_whwdNAMJl-P8Ap1v8RsOQPEJwyyJzqK6ZueXP2gBT2Zbh8Ti5plQX6h6iLVWSbZxA2sdMrvo8Bsp_gOClzeftmzGOvi34Az8Li1aTo4q0Hb9abdmD7LUn-tNlAL_/s1600/anatomy3_8.png

https://blogger.googleusercontent.com/img/b/R29vZ2xl/AVvXsEj-XUnejJDnobM3x4IijBniWPgiqrYhcUW5NDsX8As5VVP37MTpFZCl81bCHUDRhXEnoBlBHBzJ_KNvZZzsHK5cIe_NcXQWyndOSdsqDeC6TIfje_kIYKpkPKPRLusrgz9IbzQmD1oqEiyf/s1600/anatomy3_9.png

Chris Bosh (1.119 PPS), Joel Przybilla (1.112 PPS), and Chris Anderson (1.090 PPS) come out on top again, all three being among the top 10 in value by shot location. Andris Biedrins (0.860 PPS) and Andray Blatche (0.865 PPS) were also in the bottom 10 in value by shot location, but it's guys like Biedrins, Haywood (0.875 PPS), Roy Hibbert (0.876 PPS), and Shaq (0.879 PPS) who are noteworthy. The four appear in the bottom 10 of the other table, indicating that they are not as valuable to their teams for their shot-blocking abilities as we may have thought in the past by both measures.

Finally, and mostly just for fun, let's take a look at the players who tallied the most blocks since 2007 for different shot types:

https://blogger.googleusercontent.com/img/b/R29vZ2xl/AVvXsEg1UkQQJ9VG1WqVf5-OAAidPk2XEkThTSCYOmG-mzX3_75DccHbekhZ4v3Fruie7zk_ckhWFeNLbzEf8sWMnJej47yhOyQNsodpa_0iV-z5_kMs0oBf4Fe31BtpDp5NBGPXyQxlOU89_AJC/s1600/anatomy3_10.png

Whew, hope you're still with me. Marcus Camby blocked the most generic layups, reverse layups, and running jump shots since 2007, second most for driving layups. To me, this says that Camby is very good at knowing when and where the shooter is just about to release his shot, whether it's off the dribble, a reverse, or a running jumper. Meanwhile, Dwight Howard blocked the most generic jump shots and hook shots since 2007. This tells me that Howard benefits greatly from a huge vertical leap in order to swat away these type of shots. (Diversion: A quick look online tells me that Howard has a 40-inch vertical jump. Current players with higher verticals include LeBron James, Shannon Brown, Vince Carter, Nate Robinson, and Gerald Green. Retired players with higher verticals include Spud Webb, Michael Jordan, Dee Brown, Shawn Kemp, and Dominique Wilkins. Definitely no surprises here.). Finally, Andre Iguodala, Tayshaun Prince, and Kevin Durant blocked the most 3-pointers since 2007.

Alright, that's part 3 of this series. As always, feel free to leave a comment if you found anything interesting or if you think there's a better way I can look at things. In my next post, I'll take a look at how block value by shot location relates with block value by shot type and whether or not these values fluctuate from season to season for different players.


Tuesday, August 10, 2010

The Anatomy of a Block: By Shot Location (Part 2)

In case you missed it, check out Part 1 in this series, The Anatomy of a Block: Introduction.

In this post, I'll take a look at the value of a blocked shot based on the shot location. The conventional wisdom is that big men down low find plenty of shot-blocking opportunities in the painted area and that perhaps forwards and more athletic guards get blocks at the 3-point line and in the jump shot range. Each location on the grid of a basketball court can be assigned a point value based on the expected point value of a shot in that specific location. These assigned point values can then be totaled by the number of blocks in each location in order to come up with "points saved per block by shot location" for each player.

To do this, I looked at four seasons' worth of PbP data with over 750,000+ shots and their X,Y coordinates to indicate their locations. If you can imagine yourself standing behind the offense's basket, the X-axis runs from left to right along the baseline (the range of X values is 0 to 50, or 51 possible values) and the Y-axis runs from bottom to top toward and beyond the 3-point line (the range of Y values is 1 to 35, or 35 possible values). This forms the basis of a half court, where the center of the hoop is located at (25, 5.25).

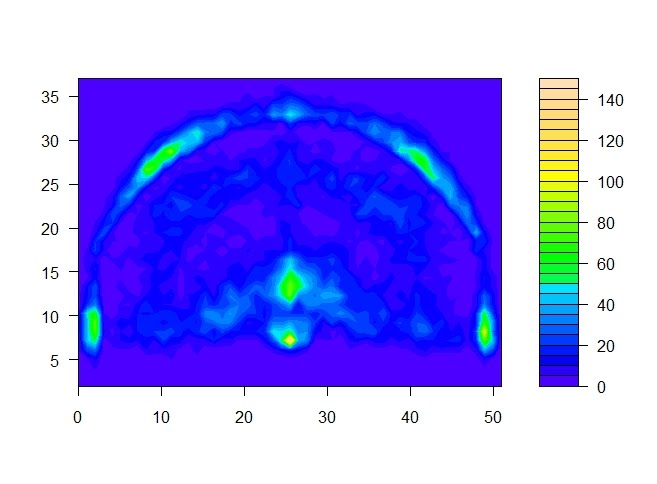
For the 51*35 = 1785 shot location coordinates I looked at, I noted the total number of shots taken in each coordinate over the past four seasons and stored it in a matrix. Here's what the shot location frequency for the NBA in that time period looks like (excuse the color scheme and note that approximately 28% of the shots were taken at rim):

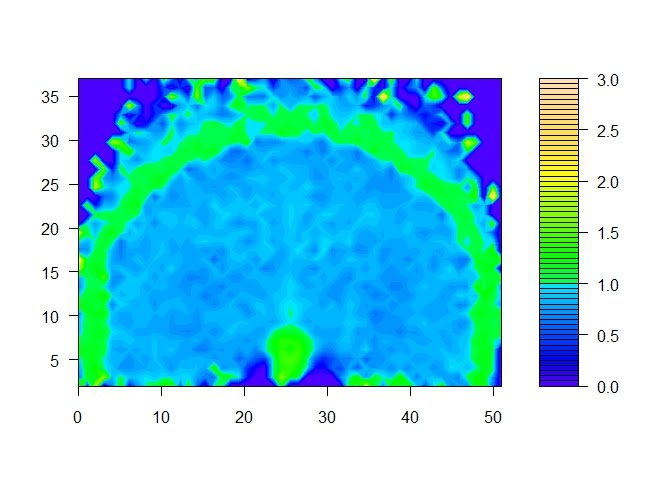
I then found the number of points scored in each coordinate over the past four seasons, and multiplied that by each element from the shot location frequency matrix. Basically, this shows me where the average NBA player was efficient with his shots, giving the expected point value for each shot location. Here's what the shot location efficiency for the NBA looks like (statistical noise shmatistical shmoise):
As you would expect, the high value shots (not necessarily high percentage) are either at rim or along the 3-point line, particular the corner 3s coming at 1.1 to 1.4 points per shot, or PPS. Jump shots just outside the key and near the baseline are low value shots, going down to 0.8 PPS. To give you a general idea of points per shot based on location, here's points per shot by distance from the basket in 2007-2010 according to Hoopdata.com:

https://blogger.googleusercontent.com/img/b/R29vZ2xl/AVvXsEhur25cJG8cSS5aqtSSzdLVbABzBSsj-O9SPOapDkjFeclBQyaafIfqWh-YgNZA_R5KBQRyrJIztytMiabEoAclguDGOBl9eLsmyy_1TeHZNzfmv5uqMbBrSt3z_9XjfWTYCYj2RAspTRZm/s1600/anatomy1.png

Similar to the shot location efficiency heat map, at rim shots return the most points per shot at 1.208 PPS, with threes at 1.081 PPS and long twos at 0.801 PPS.

Taking the expected point values of each shot location coordinate multiplied by the number of blocks by a player in each coordinate, I found the total number of points saved by location and the points saved per block. Let's take a look at the top 25 shot-blockers in terms of total blocks since the 2007 season and see how they fared in points saved per block:

https://blogger.googleusercontent.com/img/b/R29vZ2xl/AVvXsEjDinyicyHNmV_E_BMgKVfm66nm0GUH3Ws4lK3ZyHAvHd_kIGYnjL1Ke-TWBAMfoB7RkKkS5XYHnAYs1DOXL0TJm73xneo_E1oAMT7CjKcVTuEaG8MD_Cgskid3buyj0YAk0du-kblPtmR0/s1600/anatomy2.png

A quick glance at this table sorted by total blocks shows that although the top shot-blockers in block count nearly matches the number of points saved per block by location (notice how the column "Pts by loc" fades from green to yellow pretty consistently), the value of a player's blocks in terms of points saved per block varies. With the knowledge that the average is about 1.075 PPS, Andris Biedrins (0.982 PPS, or points saved per block if you prefer) and Brendan Haywood (0.987 PPS) clearly save the lowest in value per blocked shot on this top 25 list, while Andrew Bogut (1.152 PPS), Emeka Okafor (1.118 PPS), Tyrus Thomas (1.118 PPS), and Josh Smith (1.116 PPS) come out on top.

But do these shot-blockers, among the league leaders in most blocks, also lead the entire league in points saved per block? Let's take a look at the top 10 shot-blockers in value per blocked shot (minimum of 200 blocks since 2007):

https://blogger.googleusercontent.com/img/b/R29vZ2xl/AVvXsEgEh8vmRooA6rb3LDSvVA5myMK__iFcDgjrnw5BIjKeBvoZkGhaUfE2eyn4Z9gYiTYWYjHK-0YqOJUfLNXrRvq-ojy4v7D4MwgT8m0hpFUwpSkkrPI-rg4mQt-ldAVrJiSWS8nrDvM5aD3U/s1600/anatomy3.png

Gerald Wallace comes out as the player with the most points saved per block at 1.163 PPS, despite averaging just under 1.00 block a game. Paul Millsap, Lamar Odom, and Shane Battier are other notable players that you wouldn't expect to get good value for each block, at least, according to shot location (perhaps this could be an extension to Battier's underappreciated defensive value to the Rockets). The most notable player on this list has got to be Chris Anderson. Not only has Anderson blocked 2.12 shots per game since being reinstated in 2008 from expulsion due to positive tests for abusive drugs, but he has also saved 1.130 PPS for each block. Whether this makes up for his relatively lacking presence on offense, that's for another study, but Anderson certainly may be one of the best shot-blockers in the NBA today. Bogut, Okafor, and Thomas are the only players on this list to also appear in the previous top 25 total blocks list.

What about the "overrated" shot-blockers in terms of points saved per blocked shot? Let's take a look at the bottom 10 (minimum of 200 blocks since 2007):

https://blogger.googleusercontent.com/img/b/R29vZ2xl/AVvXsEgRzHrpR9tZKNPsCMbJvBn_IC27mhJh1YTAV4_vrfYWLfXUHoh-CzybG0IZE66q5S9erqyNce74A80Aj_JeoGgj-62jZF8NhUG0AJJ20cbhGy8vp4_dpSuSU8N2unexdQ8C87yVHYZwNYXr/s1600/anatomy4.png

Andris Biedrins and Brendan Haywood appear again at the bottom with the least points saved per block, despite averaging 1.46 and 1.64 blocks per game since 2007. Dwyane Wade, Shawn Marion, and Kevin Durant are notable players who don't get as much value for each block they get, but this is likely due to their guard/forward position and the fact that they defend jump shots more often than the traditional shot-blocker. I lowered the minimum blocks to 100 and found there were other guards/forwards with low PPS saved by block as well, such as Baron Davis, Francisco Garcia, Grant Hill, and Stephen Jackson, the type of players you don't find in the high value points per block list.

Finally, here's a look at 15 notable players we haven't seen yet, sorted by blocks per game. I selected 15 of the younger and up-and-coming shot-blockers in the NBA from my spreadsheet. Let's see if we can spot any value in their shot-blocking ability by location:

https://blogger.googleusercontent.com/img/b/R29vZ2xl/AVvXsEiYPYcjnuzaEsH9GtfP-2UcBjz9qltS3Ez3HvqD3orSBVbX9O4RcKtXRbZCZvZpfhWVLQTmV4G-CHSxXF59T6o2FxXBhBFOPs_Q-tAltooeJbRhXKrMt6cxjVwwJJGzOXtaiiqABgEVCd_W/s1600/anatomy5.png

So I lied, sue me. Alonzo Mourning and Dikembe Mutombo aren't exactly young and up-and-coming, currently aged 40 and 44 respectively. But for the years that this data was available for, Mourning (1.080 PPS) and Mutombo (1.124 PPS) weren't too shabby at blocking high value shots while approaching retirement when compared to the NBA average of 1.075 PPS. Hasheem Thabeet (1.119 PPS), Taj Gibson (1.115 PPS), and Serge Ibaka (1.084 PPS) are notable rookies from the past season with high value blocks based on location as well.

Looking at Greg Oden's 1.077 PPS and 1.43 BLK/G being above average, there is little doubt that his shot-blocking ability along with Camby (1.103 PPS, 2.79 BLK/G) and Przybilla (1.141 PPS, 1.29 BLK/G) will give the Portland Trail Blazers multiple defensive weapons to frustrate opposing offenses in the paint. If the Blazers ever need to go big, they could conceivably have two of three of these shot-blockers on the court at any given time along with LaMarcus Aldridge. They will take away minutes and block opportunities from one another, but no matter which way you slice it, it will be a force that could lead to many defensive stops if they spread out the defense effectively. The Camby/Przybilla/Oden combination does sound enticing, but the Blazers must allocate minutes and usage rate to their shot-blockers efficiently in order for the three-headed tandem to be effective.

That's it for part 2 of this series. If there is something you like (or didn't like), please feel free to leave a comment! In my next post, I will take a look at blocks based on shot type, with an interesting look at which players blocked the most dunks, jump shots, layups, etc.

Monday, August 9, 2010

The Anatomy of a Block: Introduction (Part 1)

Blocks are a fundamental statistic in basketball. Along with steals, the number of blocks is often recorded and cited by fans and writers in order to evaluate a basketball player's defense. Generally, fans attribute steals to small and fast guards with quick hands, while blocks are a contribution by tall, high-flying centers and power forwards who can get off the ground quickly. No doubt, such qualities are assets on the defensive end of the basketball court, and racking up steals and/or blocks force the worst kinds of turnovers for the opposing offense, as many of them result in fast break opportunities for the defensive team in transition.

Yet, the number of blocks a player gets is but a summation of a general defensive weapon, and says nothing of the value that the actual block gave to the defense by preventing a basket opportunity on a shot attempt. Sure, players like Hakeem Olajuwon racked up hundreds, even thousands of blocks in their careers to make cases for themselves as one of the best defensive centers in NBA history. And this study is not trying to take away from those exceptional centers who were able to gain much for their teams by swatting away multiple balls on a nightly basis.

However, when it comes down to it, fans look at the number of blocks in a given season and use that as a ranking basis for the best defensive big men in the league. This is under the incorrect assumption that all blocks are the same. Are all blocks created equal? Does blocking a lay-up bring the same value as blocking a jump shot?

A study by a professor at the University of Chicago Booth School of Business named John Huizinga (you may know him as Yao Ming's agent) shows that, no, not all blocks are equal. At this year's MIT Sloan Sports Analytics Conference, Huizinga presented a paper titled "The Value of a Blocked Shot in the NBA: From Dwight Howard to Tim Duncan." In it, Huizinga explains how he and Sportsmetricians Consulting's Sandy Weil developed a database called Chances, using data provided by STATS, LLC. to compile the context of each event for the past 7 years, events such as blocks. The idea for this database is simple: instead looking at box scores, look at play-by-play accounts of the game in order to ascertain individual offensive opportunities. As Sandy Weil explains at his website, the two believe that "chances" are a very useful unit of account for many types of analysis of basketball. It allows you to easily sort and filter the context of an event, for instance, what happened before a shot attempt or what happened after a steal.

One of the key concepts that Huizinga presented about in order to understand the value of blocked shots was the preblock situation. This is basically what happened before the block occurred. As Sebastian Pruiti explains at NBA Playbook, this allows the analyst to differentiate between a block of a layup coming off a fast break opportunity vs. a block of a long off-balanced two-point jump shot, understanding that the former is more valuable than the latter. The idea that these two types of blocks are different comes from the fact that all shots taken have its own values, whether the shot was a slam dunk or a turnaround jumper. This leads us to expected point value, and since every block is attributed to a shot, the value of a block is naturally related to the expected point value of the shot attempt.

Looking at Pruiti's recap of the presentation, Huizinga closed his thoughts by going over what he calls "block value." To quote Pruiti, "to determine block value, Huizinga used the formula Points Saved + Points Created where Points Saved equals the effect of a Block on Opponents Expected Points during this possession and Points Created equals the effect of a Block on Own Team’s Expected Points during the next possession." This formula allowed Huizinga to determine overall block value, a better indicator of who was the best "shot blocker" in any given season.

Without having the benefit of the same database and viewing of Huizinga's paper (I can't seem to find it on Google, if it is online), I decided to take the idea Huizinga hatched and to do my own analysis with Basketball Geek's PbP data from the past four seasons. Thanks to Ryan J. Parker's hard work, there is a wealth of shots data in this PbP dataset, from the location of each shot to the shot type (ranging everything from turnaround fade away to driving reverse layup to putback dunk).

Whereas Huizinga looked at both points saved and points created (blocks that lead to fast break points, for instance), I looked at only points saved. I've developed two models for estimating the value of blocked shots (I will dedicate one post to each):
  1. Points saved per block by shot location
  2. Points saved per block by shot type
For the first model, this distinguishes blocked shots at rim (layups or dunks) vs. blocked 3-pointers or long 2s. Based on shot location, we can look at the value of a shot in any X and Y coordinate on the basketball court based on four seasons of data, and attribute each block to its corresponding value based on shot location. Adding this all up, we can determine which players saved the most points per block based on their shot location.

For the second model, this distinguishes blocked shots based on shot type, so dunks from layups, turnaround jumpers from pullup bank shots, driving reverse layups from tip-ins. Each block is attributed to a corresponding shot type value for which the shot was blocked. Adding this all up, we can determine which players saved the most points per block based on their shot type (with the added bonus of which players were the best at blocking dunks, layups, 3s, or mid-range jumpers).

In my next few installments of (at least) two parts, I will look at some of the findings I found from each block value model.

Finally, as an ode to the work that has been done by John Huizinga and Sandy Weil, here are some of their findings from what I could gather up that I may refer back to in my next posts (paraphrased from NBA Playbook and Peter Keating on ESPN Insider):

  • A jumper has an expected point value of 1.04.
  • A layup has an expected point value of 1.54.
  • 69% of Brendan Haywood's blocks were jumpers (31% layups).
  • 91% of Jermaine O'Neal's blocks were layups (9% jumpers).
  • Tim Duncan saved 1.12 points per block in 2008 (best season).
  • Dwight Howard saved 0.53 points per block in 2008 (worst season).

This introduction post is dedicated to Huizinga's work with Weil. Hopefully my findings will agree with and add on to theirs.

Sunday, August 8, 2010

Carmelo's Shots Blocked

I've been out of town for the weekend. It's amazing what a few days cut off from the Internet leaves in your Google Reader and RSS feeds, especially this breaking news that Kendrick Perkins signed with Boston for less than $800K.

What's also amazing is how a largely objective article in the sports world causes readers to scream for the firing of a writer as well as the boycott of the world leader in sports. Tom Haberstroh over at ESPN Insider had a great article a few days ago about Carmelo Anthony being an inefficient offensive player and not worthy of a max contract (in a Joe Johnson-less world). He presented pretty strong evidence that Carmelo is at least not one of the top 5 current players in the NBA, if you take his offensive ratings, the Nuggets' pace factor, and his sheer number of shots taken (wasted?) into account. Sure, Haberstroh's article may come across as written in order to belittle some of the conventional statistics that Carmelo Anthony has piled upon himself since 2003, but it's not like he's claiming that Carmelo should be riding the bench, just that he isn't as elite as fans and the media glorify him to be. It's pretty disconcerting how many readers can get offended by a statistical look at things so easily, but that is a barrier that we have to break in order to get a larger portion of the sports world to understand the usefulness of new, perceptive statistics that take context into account. It adds to our understanding of sports from what we watch through our eyes, not replaces it.

One of the things that Haberstroh mentioned about Carmelo was that he "got his shot blocked a whopping 109 times last season, which ranks as the second-highest total in the league, according to Hoopdata.com." I've been looking at blocks data in quite a bit of detail, and I thought I'd take a look at Carmelo's blocked shots on the offensive end.

A quick look at the 2006-2010 dataset shows that Carmelo got his shot blocked (at least) 373 times, which, as Haberstroh mentioned for the past season, is second-highest in the league during the past four years. That's 1.35 blocks per game. Only 31 players have averaged at least 1.35 blocks per game on the defensive end since 2006, so Carmelo is almost doing opposing defenses a favor by allowing his shots to be easily blocked. Considering that many of the players on the top 10 list of shots blocked include power forwards or centers, who understandably take a lot of shots at rim, Carmelo gets his shots blocked at an abnormally high rate for a high usage small forward.

I looked at my blocks by shot location model as well as my blocks by shot type model to take a deeper look at Carmelo's shots that were blocked (if anyone knows a less awkward way of wording this stat in order to differentiate it from its defensive counterpart, let me know). Carmelo lost 405.26 points by blocks based on shot location, which comes out as 1.09 points lost per block. If you consider that of the top 20 players with the most blocked shots on the defensive end in the past four years, 13 of them saved more than 1.09 points per block, not only does Carmelo have the second most shots allowed to be blocked, but he may have also been among the league leaders of points lost per block allowed.

Looking at blocks by shot type might be even more telling. According to Basketball Geek's PbP dataset, Carmelo had 3 threes blocked, 8 dunks blocked, 109 jump shots blocked, and a whopping 253 layups blocked in the past four years. It all totals out to approximately 1.00 lost points per shot blocked based on shot type (most of the top shot blockers also save approximately 1.00 points per shot). However, Carmelo's had 59 driving layups blocked, good for second most in the NBA. With driving layups worth about 1.46 points per shot, that's quite a bit of high percentage shots that Carmelo allowed to get away. Carmelo is one of three players to be both in the top 11 of jump shots blocked and layups blocked, with the generic jumper worth 0.69 PPS and the generic layup being worth 0.91 PPS. Carmelo only had 6 dunks blocked though, a category of blocked shots that goes as high as 25 in the past four years (Emeka Okafor). Finally, Carmelo is one of four players in the top 10 of shots being blocked on the offensive end without even ranking in the top 120 in blocks on the defensive end.

Carmelo may do a lot of things well on the offensive end because of his athleticism, durability (at least in a minute-by-minute basis), and points-scoring. But he is most definitely not among the league leaders in offensive efficiency, and has several teammates in Denver who shoot the ball more efficiently than he does. If Carmelo can take better and more efficient shots (which includes getting blocked less), he may yet become one of the stars in the NBA. Until then, the team that gives him a long-term max contract in 2011 may regret it if they're basing it on Carmelo's past performance and if he continues to heave a high volume of inefficient shots.

Wednesday, August 4, 2010

Update on Value of Blocked Shots

I do have an update on my research on the value of blocked shots. I made two preliminary rankings lists of the value of blocks by the leading blockers in the NBA between the 2006-2010 seasons. For the first list, I calculated points saved per block based on the shot location. I found that Brendan Haywood and Andris Biedrins (394 and 370 total blocks in 2006-2010, respectively) saved 0.987 and 0.982 points per block while Andrew Bogut (382), Chris Anderson (322), and Paul Millsap (319) saved 1.152, 1.130, and 1.131 points per block respectively, based solely on the location of the shot (so the value of blocking a running slam dunk is the same as that of a reverse layup in this model).

For the second list, I calculated points saved per block based on shot type. This is where I ran into problems, as although every shot is categorized with a specific shot type (no blanks or uncategorized shots), there are many idiosyncratic shot types such as running finger roll layups vs. driving finger roll layups. I've kept these for now (they should have negligible effect on the final values), and have not generalized the categorizations as of yet (say, into 3pts, dunks, layups, jump shots, etc.), but there is no question that dunks produce the most points per shot (PPS) of all the generic shot types, ranging from putback dunks at 1.81 PPS to running slam dunks at 1.97 PPS. Blocking dunks appears to be the most valuable skill for blocking any type of shot (all while earning a spot on Top 10 Plays on Sportscenter), while 'risky' jump shots such as the running jump, driving jump, and turnaround jump go down toward 1.06 PPS.

Anyway, more details for points saved per block based on shot type are to come, but Chris Anderson comes near the top again for the second model, saving 1.09 points per block based on shot type, while Andris Biedrins is near the bottom again, saving only 0.86 points per block based on shot type.

After fine-tuning both models of points saved per block (PSPB?) by shot location and PSPB by shot type, my plan is to compare them with a basic statistical report, then combine the two models, either with a straight up average or something to that effect. I'm also interested in looking at the results in a season-by-season format rather than all four seasons to see if blockers tend to retain their shot-blocking ability in certain shot locations or against certain shot types.

Hopefully, I can share some of my research with John Huizinga to see if our rankings agree. For now, I'll be searching for a way to combine shot location data with shot type data (the sample size becomes too small if I try to calculate PPS by shot location AND by shot type simultaneously), but I'll be sure to post a finalized rankings list as well as my complete methodology based on Ryan J. Parker's PBP data when I'm done.

Monday, August 2, 2010

Time Splits, FG%, and eFG%

Came up with a couple more basketball shot location visualizations. I can see more and more how this data can be used in addition to visualizing hot zones for players, teams, and etc. but it's always fun to see more basketball graphics.

It's definitely been an exciting week taking more and more of an indepth look at visualizing some of the data out there. All of that and I've only just scratched the surface of the PITCHf/x data. I hope to do much more PITCHf/x visualization analysis in the future, perhaps after I've exhausted all my questions concerning the NBA and NFL PBP data.

Something to look for in the future: I've been thinking more and more about John Huizinga's paper/presentation at the MIT Sloan Sports Analytics Conference about the value of a blocked shot. Sebastian Pruiti's summary of Huizinga's work was indeed very helpful for those of us who weren't fortunate enough to attend the conference back in March. You can check it out over at his acclaimed blog, NBA Playbook. Anyway, I've been looking at using Basketball Geek's data (under the alias Ryan J. Parker) to see how I could use points per shot by location to assign a value to each block between 2006-2010, since most of the blocks are attributed to their corresponding shot locations. My preliminary calculations show ranges from Brendan Haywood saving 0.987 points per block to Andrew Bogut saving 1.152 points per block, which seems to agree with Huizinga's conclusion that Haywood is not as valuable a shot blocker as traditional numbers indicate. Still, my preliminary estimates aren't that promising, but I'll continue to dig into it. Huizinga did have access to more crucial data (such as turnovers leading to blocks, etc.) but I believe that he did not use shot locations to determine expected values of shots blocked. Instead, he used preblock situations and shot types, which probably is more effective. Anyway, I'm going to continue some work on this, and hopefully I'll publish my findings on Think Blue Crew soon (with a look at players who were blocked the most as well).

Here are the time splits of NBA shot location frequencies for 1st quarter, 2nd quarter, 3rd quarter, 4th quarter, first two minutes of 1/2/3/4 quarters, and last two minutes of 4th quarter plus overtime. And here... we... go.:

https://blogger.googleusercontent.com/img/b/R29vZ2xl/AVvXsEgQ5WUFKprEs9wdnNYDI_EUqUxiJwFSJuFxz2Q3RfMfDlugk4uqBNWNYRojywb4suv5BHgY61yLVY7hOfR7Jv23OsBPl0UcTNBQLOyAvtmn4GZGuTajrOzyfzSIaVcVJefIX8AdJ1EwBpdV/s1600/Untitled1.png
https://blogger.googleusercontent.com/img/b/R29vZ2xl/AVvXsEjrPV67wAaHXDx7lp9ktifXrTfxI_yoX6MsBWgUXGnwLqlREupmsDsN9m-I7Ux2txNS5IHs-PYPgjSIewit2jM1_5tp45Jiu90Aor8p1NiRethEYfqmKAxJH1yG7gNYz1arhsAg6BAbjc5o/s1600/Untitled2.png

https://blogger.googleusercontent.com/img/b/R29vZ2xl/AVvXsEgDm-nna-jKzgKMhgEukgU7ajYzfSK9_rbEicr35aAwCPfmunXiE63c2IzVy2ztvoAo7mgiI1-URbTy0GIKbISrjJBQPWwt7BgnfmngpCGS7hNxngcV8t1fogXxOY2vDw8ZXDphgTgyj0yo/s1600/Untitled3.png

The following two graphs are of FG% and eFG% by shot location. Here, I hope to emulate what Eli Witus did over two years ago at Count The Basket, when he compiled his own play-by-play data to produce heat maps of FG% and eFG% by shot location. Check them out here and here. The color schemes and scales are a little different, but the idea is the same. For those of you who don't know, eFG% is effective field goal percentage, which takes the value of 3 pointers into account by adding an additional 0.5 for each 3pt made ((FGM + 0.5*3PTM)/FGA). Take a look:

https://blogger.googleusercontent.com/img/b/R29vZ2xl/AVvXsEjRmwXPMgpxKAwtGvPgmOUTLYa1KxJIZqHJT9519UKRYsSC_8ssAfn2pGS5HY3Nd4ObMzkJgGnmqF9RgYtcdOjv52qnQcA1Llm-FMeM5TfQur5ZmLtT2rnLnrW4k9FF1zNqRgzF7HHkQCAe/s1600/Untitled4.png

Anyway, having the titles, axes labels, and more contrasting color schemes adds to the visualizations.

This is probably the end of the mass posts of different looks at shot location heat maps. If I use heat maps and filled contours again in the future, I will probably do studies on different players and different teams, but hopefully, this gave you a good idea of the sheer amount of information contained in Ryan J. Parker's dataset and the amount of exciting basketball analysis that can be done.

Sunday, August 1, 2010

Assists, blocks, and team shot location frequencies

Since the play-by-play data records which shots are assisted and blocked, I filtered the 2006-2010 data in order to see where shots are assisted (locations of the shot made after an assist) and where shots are blocked:

Where Assisted Shots Are Made (2006-2010)

Where Blocked Shots Are Missed (2006-2010)

Hmm... these visualizations aren't very telling. It's clear that most shots are blocked near or at rim, while the assisted shots location frequency looks distributed almost exactly the same as the NBA total shot location frequency. Counting statistics don't tell the full story about assisted shots vs. unassisted shots, since a high percentage of them will be at rim anyway. Looking at percentages per field goal per location would return a more interesting plot. I plotted the same graphs, except with assists / field goals made and blocks / field goals missed to see the percentages of field goals made that were assisted as well as the percentage of field goals missed that were blocked:

Assists/Field Goals Made by Location (2006-2010)

Blocks / Field Goals Missed by Location (2006-2010)

Interestingly enough, a very high percentage of 3 pointers are assisted, and almost 100% of all corner 3s are assisted. If you consider that the basket is at (25, 5.25), the locations with the lowest percentage of shots that are assisted are around the top of the key. (Note: changes to make in the future include the color scheme of the color palette and an outline of the 3 pt line, the key, and the basket. This is possibly the first graph so far that the basketball court is not apparent).

For the blocks per field goals missed graph, looks like a high percentage of shots near the basket are blocked, which makes sense. Notice the blips of yellow/green in the top left corner of the graph, about 30-35 feet from the basket. It seems that someone or a few players were blocked trying to take a long 3, and it just so happened to be in the same location. I looked it up. Two shots were missed at that particular location, and one of them was blocked (Donyell Marshall on Kevin Martin at 4,30). Another note for the future: remove statistical noise wherever possible.

Next, I took a look at the shot location frequencies of different teams:

LAL Shot Location Frequency (2006-2010)

PHX Shot Location Frequency (2006-2010)

ORL Shot Location Frequency (2006-2010)

HOU Shot Location Frequency (2006-2010)

CHI Shot Location Frequency (2006-2010)

ATL Shot Location Frequency (2006-2010)

IND Shot Location Frequency (2006-2010)

NJN Shot Location Frequency (2006-2010)


This time, I tried to standardize the scales (made the maximum of any # of shots in any location to be 150) but again, it's not completely standardized because different teams took a different number of shots over the course of four seasons. Still, there are some trends you can see here. The Lakers, Suns, Magic, and Rockets distribute shots across the floor pretty well, taking a high percentage shots at high percentage locations such as at rim and the corner 3. The Bulls, on the other hand, do take a lot of long 2-pointer shots in comparison, an inefficient location to make buckets. The Hawks post up quite a bit as well as lay up and dunk at rim, as do the Pacers. The difference is that the Pacers take a higher percentage of 3 pointers, and the Hawks take a lot of long 2s. The Nets also tend to take a lot of long 2s, but look more or less like the average NBA shot distribution.

Looking at the shot location frequencies of teams over a 4-year period does have its limitations. It might be more interesting to see those shot location frequencies change over time for a team, after standardization. Next time, it'd be more interesting to compare shot efficiencies by team to determine which teams are locating their shots in efficient locations and how successful they are, but for now, this is what I've got.

Saturday, July 31, 2010

A first look at shot location visualizations

On the subject of investigating play-by-play data for the first time, Ryan J. Parker over at www.basketballgeek.com has provided the NBA stats community with great NBA play-by-play data between the 2006-2010 seasons. I downloaded that data this past week for the first time (even though I've known about it for awhile now), and I've become inspired to take a deeper look at the entire dataset.

Using a macro that I found via Google called "Merge CSV files," I was able to combine all of the play-by-play data in single spreadsheets, one for each of the four seasons that Basketball Geek has available.

I then filtered each of the spreadsheets by etype, and chose shot, in order to return all plays in each season that were shots. I took each of these filtered datasets combined them into a fifth Excel file to list all shots that happened in the past four regular seasons of the NBA (turns out to be 763,444 shots, which unfortunately does not agree with Basketball-Reference.com's 796,617 shots, something that I will ignore for now due to the sheer amount of entries here).

This shots data has everything from players on the court at the time, who the assist went to, who blocked the shot if it was, the result (made or missed) type of shot (ranging from 3pt to driving layup to pullup jumper to running bank shot), and, get this, the X and Y coordinates of each shot. And with a general knowledge of filter and pivot tables and the like, I've come up with a lot of interesting findings.

Using the same data that I've compiled, Jeremy Greenhouse over at The Baseball Analysts was able to chart visualizations of shot locations. I decided to give this a try myself, knowing a little bit of R from class.

With the help of Jeff Zimmerman's Advanced Graphing Techniques series over at Beyond the Box Score, I was able to write the R code to map contours and heat maps based on data.

Here's some of the preliminary images I came up with (without axes labels and titles, mind you. I've just tried these last night, and this is my first look):


Carmelo Anthony Shot Location Frequency (2006-2010)

Danny Granger Shot Location Frequency (2006-2010)
Dirk Nowitzki Shot Location Frequency (2006-2010)

Dwyane Wade Shot Location
Frequency (2006-2010)

Kobe Bryant Shot Location
Frequency (2006-2010)

LeBron James Shot Location
Frequency (2006-2010)
Tim Duncan Shot Location Frequency (2006-2010)

NBA Shot Location
Frequency (2006-2010)


NBA Shot Location Heat Map and Expected Points per Shot (2006-2010)
Please note that the scales are all off (except the last one) so you probably shouldn't compare the colors between player graphs (the color palette scale actually refers to a raw count of number of shots taken, so it's not standardized by minutes played or whatever. The last one refers to expected points per shot that I calculated). The X and Y axes are in feet, so consider that the center of the basket is at coordinates (25, 5.25).

However, you can definitely make sense of the graphs and tell the tendency of where some of these superstars/stars tend to shoot. Carmelo and D-Wade fans know that they love their hot spots, and these graphs confirm their tendencies. Dirk and Kobe basically can shoot anywhere on the court, while Granger loves to go at rim or take 3s not on the baseline. Tim Duncan is your classic post-up player, so he hangs out near the bottom of his frequency graph there.

Some things to add on to these graphs when I make them in the future:
  • title and xlabel and ylabel and etc.
  • Superimposed outline of 3 pt line and key lines and etc.
  • Legend for made and missed shots possibly?

And other graphs to take a look at in the future:
  • Some way to standardize shot location frequency scale (shot percentage? as a fraction of total NBA shots in that location? or as compared to the league average tendencies?)
  • Home vs. Away splits
  • 1st, 2nd, 3rd, 4th quarters, last two minutes of regulation + overtime
  • Field goal % and effective field goal %
  • Expected points per shot for players (are players taking shots where they are successful at?)
  • Types of shots, by NBA and by player
  • Assisted shots (Nash-assisted shot locations, NBA assisted shot locations)
  • Offensive rebound locations (need X-Y coordinates of shot in previous play before offensive rebound)
  • Any additional suggestions

Anyway, I have a short rest of the summer ahead of me to generate more of these graphs and take a look at some of these in greater detail. There's definitely a lot more stuff and analysis to do with a huge database of NBA play-by-play data categorized by a lot (but not everything). But right now, generating heat maps and these visualizations interest me the most. Should be fun.