"Someone created the box score—and he should be shot." -- Daryl Morey (McCormick '96)
Monday, September 20, 2010
Rivera's Cutters @ FanGraphs
Saturday, September 4, 2010
Comparing Swing-Happy Contact Zones
Against fastballs, swing zones vs. contact zones:

Against sliders, swing zones vs. contact zones:

Against curveballs, swing zones vs. contact zones:

And against changeups, swing zones vs. contact zones:

Generally, they look the same as their swing zones, although Francoeur really shouldn't be swinging at so many changeups out of the zone because he doesn't make much contact off of them. Interesting plots, but not necessarily groundbreaking research here. I'm inclined to move on, because it's college football Saturday. Finally.
Friday, September 3, 2010
Comparing Swing-Happy Swing Zones
Let's take a look at the 50% swing zones of each of these hitters by pitch type. First up, fastballs:
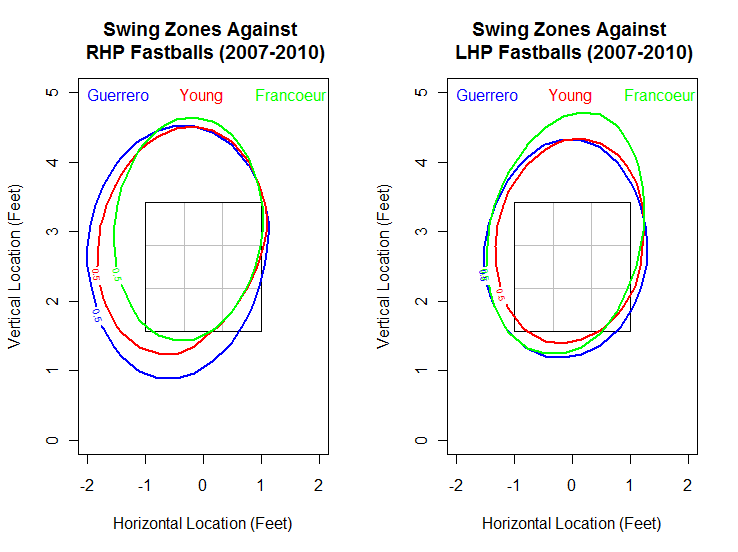
Vlad swings at more low RHP fastballs than the other two, but Francoeur takes high LHP fastballs, even swinging at fastballs 1.5 feet above the strike zone 50% of the time. Here's sliders:
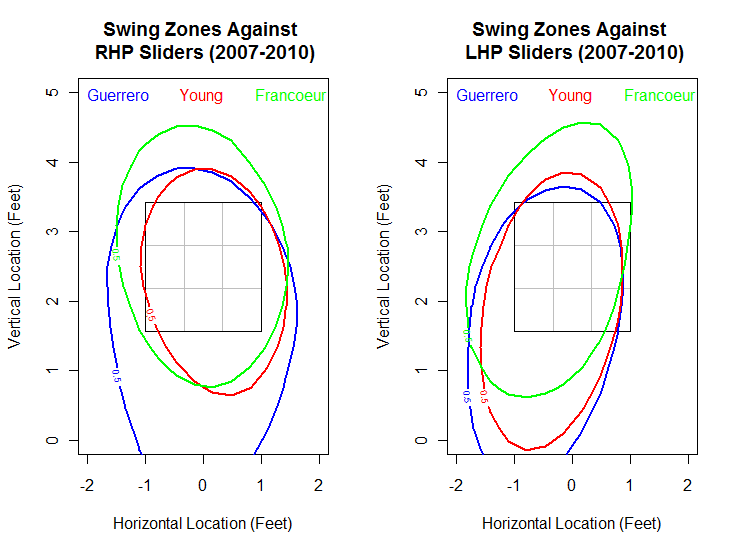
Vlad takes a hack at a lot of sliders in the dirt from both handed pitchers, and look at Francoeur again. He also really likes to take a chance at those high sliders too. Let's look at curveballs:
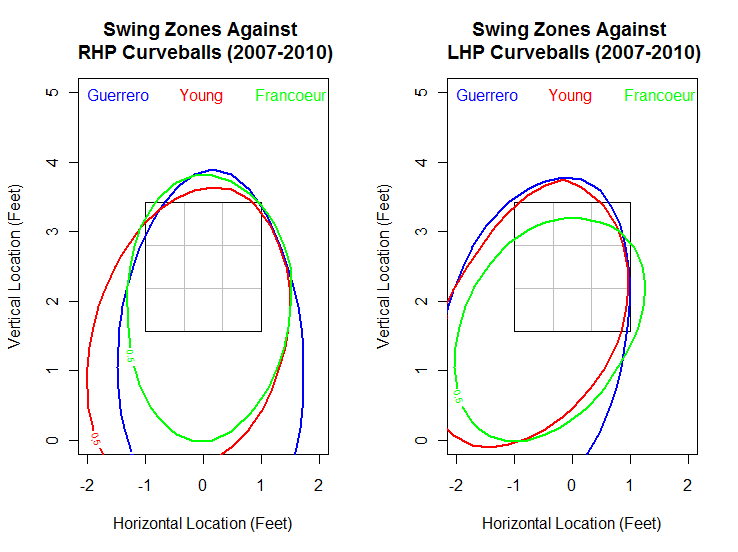
For once, Francoeur doesn't look as vulnerable against curveballs (relatively speaking) compared to Delmon Young and Vlad. All three hitters are righthanders, so you can see the same weakness against LHP curveballs coming low and inside. Finally, here's a look at changeups:
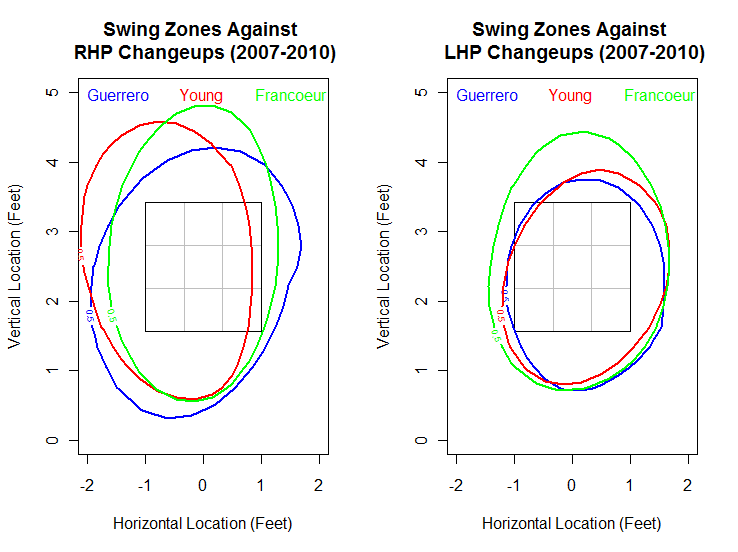
All three hitters don't generally swing at inside changeups from LHP, but Francoeur again likes those high changeups. The RHP plot is particularly interesting, as Delmon Young's swing zone goes up and inside, Francouer's swing zone reaches directly up almost two feet above the strikezone, and Vlad swings at a lot of outside changeups from RHP.
Although Vlad swings at the most pitches, both pitches in the strikezone and outside the strikezone, many of Francouer's 50% swing zones are larger than Vlad's. This means Francouer's outside-the-strikezone swings are more widely distributed than Vlad's. For a professional baseball player who thinks high on-base percentages equates passivity, I don't expect Francoeur's habits to change. I mean, he is the guy who was once quoted as saying, "If on-base percentage is so important, then why don't they put it up on the scoreboard?"
Tuesday, August 31, 2010
Matt Kemp's Struggles: Fastballs and Breaking Balls
A very short Cliff Notes version. Basically, Matt Kemp has been struggling this season, and even if you account for the low BABIP, he is still striking out at a higher rate this season compared to last. What also confounded me that even though he has a higher strikeout rate, he is also setting a career high in walk rate as well. Usually, drawing walks and getting struck out are thought of as tradeoffs, opposite ends of the "patience scale." Kensai also had a meticulous look at the changes in Kemp's swinging mechanics, and he did find a change that hopefully the Dodgers are aware of.
I would like to extend on Kensai's post using PITCHf/x. There are two areas I'd like to investigate: 1) Is Kemp swinging at more strikes in 2010 compared to 2009 and how? and 2) Is Kemp making less contact in 2010 compared to 2009 and how?
To answer these two questions, I'd like to look at Kemp against all fastballs (four-seamers, two-seamers, cutters, and splitters) and against all breaking balls (curveballs, sliders, and changeups). Let's get started with a table of Matt Kemp's plate discipline and swing outcome rates in 2009 vs. that of 2010, broken down between fastballs and breaking balls and by pitcher's handedness:
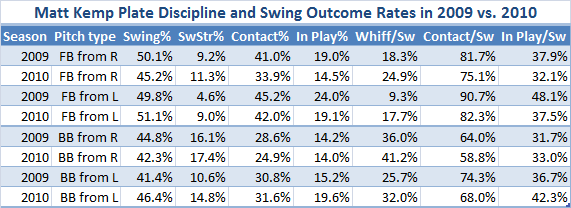
A lot of numbers in this table. When reading this table, be sure to remind yourself that the blue rows are last year and the white rows are this year. FB stands for fastballs and BB stands for breaking balls. Changes to note between 2009 and 2010: Kemp is swinging less against pitches from RHP but more against pitches from LHP. But in all cases, he is getting more swinging strikes, as well as making less contact, save breaking balls from LHP. This in turn results in less balls in play from Kemp. The last three columns are at a per swing rate (whereas SwStr%, Contact%, and In Play% are per pitch). When Kemp swings, he is whiffing far more in 2009 than in 2010 against BOTH fastballs and breaking balls and RHP and LHP. He is also getting less contact on the ball when he swings in all cases (again, Kemp has performed better in 2010 in In Play% only against breaking balls from lefties).
I have a lot of plots coming up, so I'd like this to be organized and I'll do my best to make concise inferences from the plots. I will be looking at the swinging strike percentages and contact percentages of each combination of fastballs/breaking balls and against righty/lefty. The plots on the left are 2009 and the ones on the right are 2010. There will be four sets of four plots each in the following order:
1) Kemp against RHP fastballs in 2009 vs. 2010 (SwStr% and Contact%)
2) Kemp against LHP fastballs in 2009 vs. 2010 (SwStr% and Contact%)
3) Kemp against RHP breaking balls in 2009 vs. 2010 (SwStr% and Contact%)
4) Kemp against LHP breaking balls in 2009 vs. 2010 (SwStr% and Contact%)
First up is SwStr% and Contact% of Matt Kemp against 1) RHP fastballs:
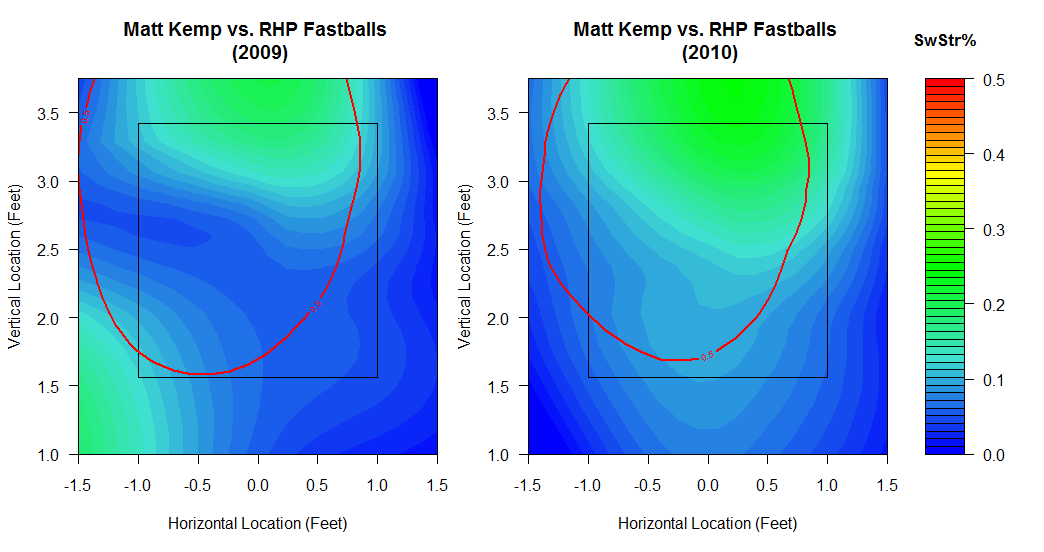
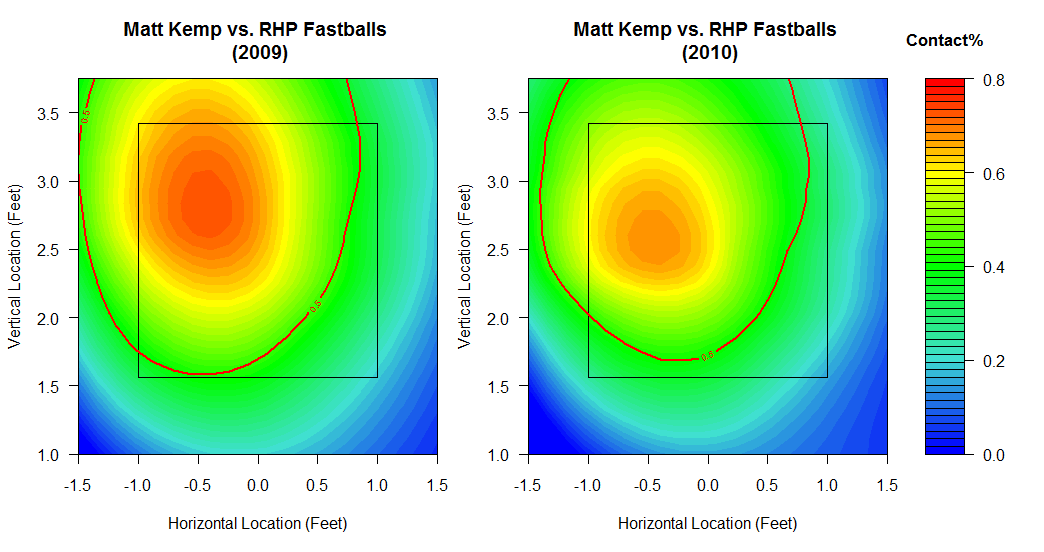
The red contour lines tell us that Kemp chooses to swing 50% of the time when a ball is thrown within the contour line. This is what I call Kemp's swing zone, so the red circles refer to this. Kemp is swinging at RHP fastballs less in 2010, but is whiffing at a much higher rate as well. He is also making much less contact. The top two graphs show Kemp swinging and missing more, while the bottom two graphs show Kemp making less contact, particularly on high inside fastballs.
Second is SwStr% and Contact% of Kemp against 2) LHP fastballs:
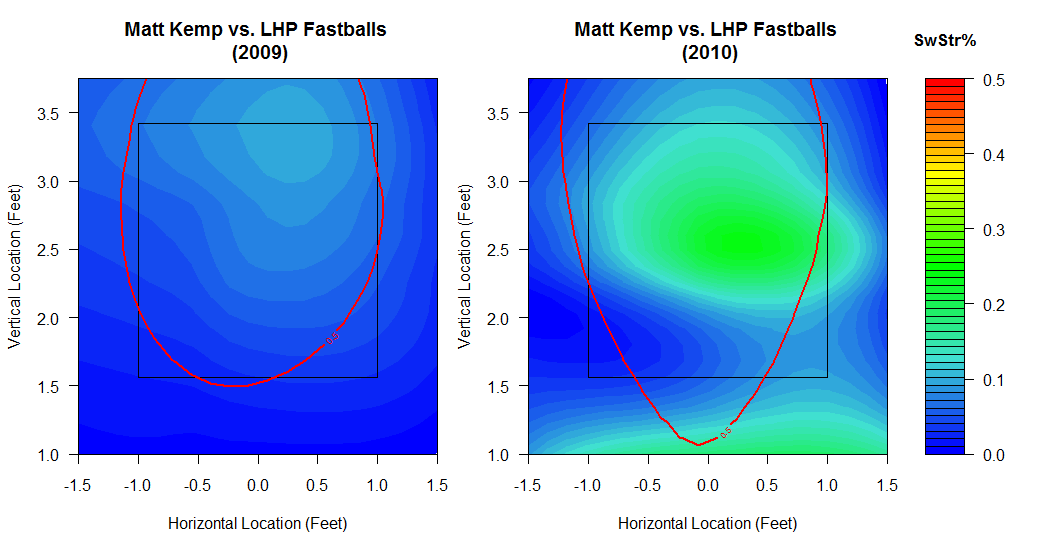
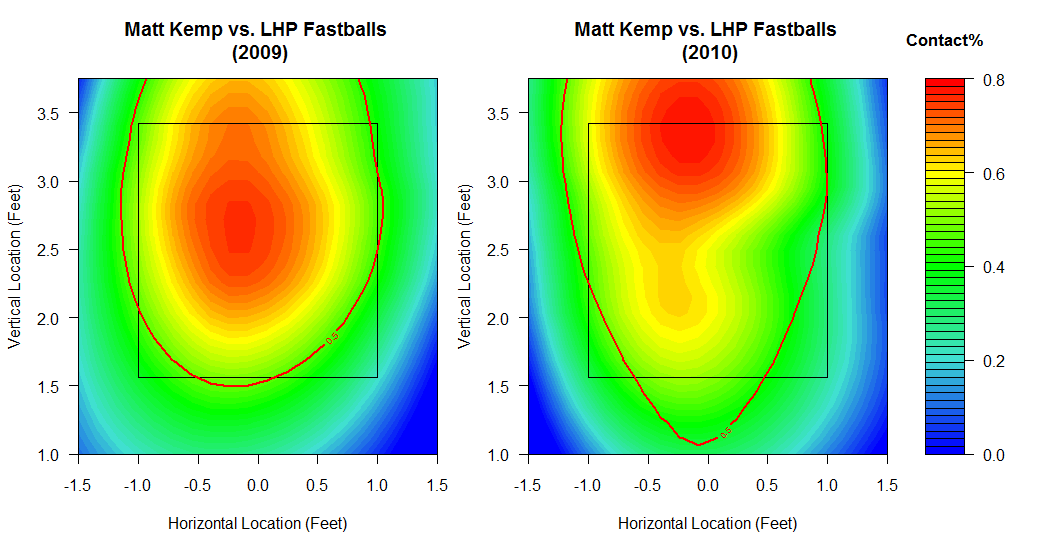
Here in his swinging strike plots, Kemp has actually started to swing more on LHP fastballs down and out of the zone, so his swinging strike rate there is up. But he is also missing a lot more LHP fastballs this year that come down the middle over the plate, ideal pitches for the right-hander to hit out of the park. Looking at his contact plots, we see similar colors in where he makes the most contact, but we see a huge shift. Last year, Kemp made contact off a lot of LHP fastballs down the middle of the plate, but this year, the epicenter of that contact hotspot has shifted a full foot up from the direct middle of the zone to the top of the zone. We can infer that Kemp is making less contact off the sweet spot of his bat, and making more high fastball contact that usually result in pop outs.
What about breaking balls? Third is Kemp's SwStr% and Contact% against 3) RHP breaking balls:
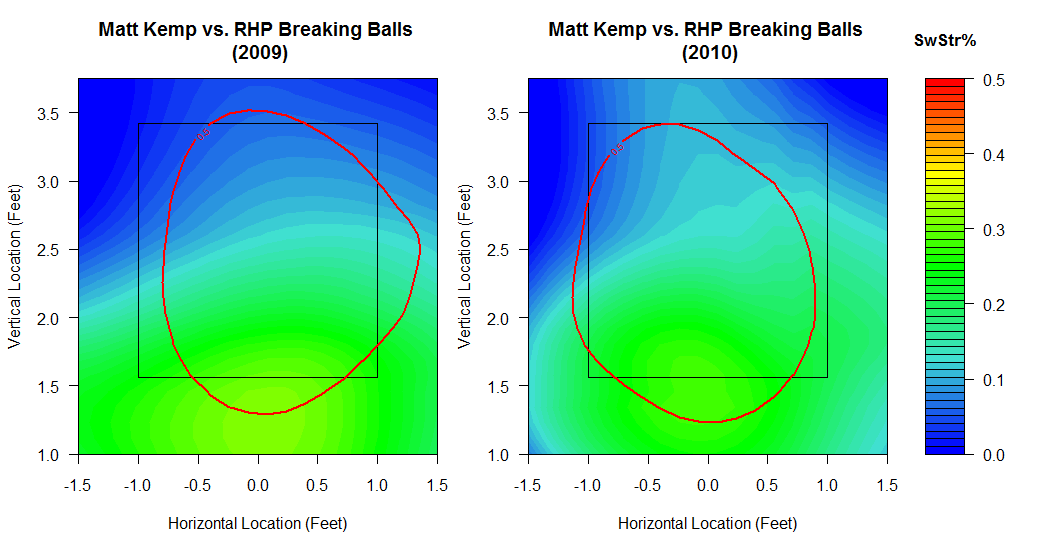
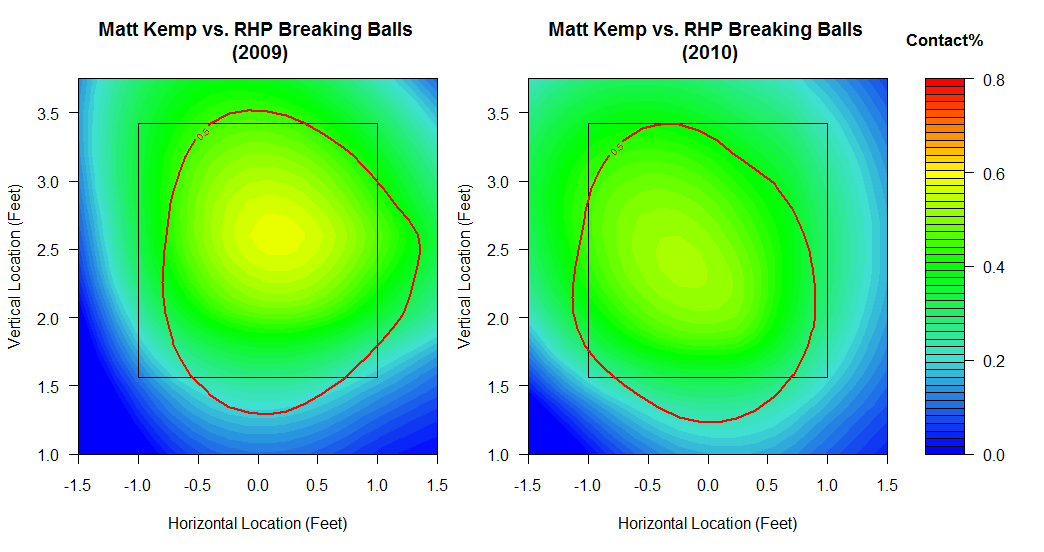
The SwStr% plots don't seem to change much for RHP breaking balls. Kemp is swinging more, however, on inside RHP breaking balls than before. He is clearly making less contact off RHP breaking balls this season compared to last. Last year, it also looks like Kemp made more contact off RHP breaking balls coming to the heart of the plate.
Finally, let's look at the fourth and final set of plots of Kemp's SwStr% and Contact% against 4) LHP breaking balls:
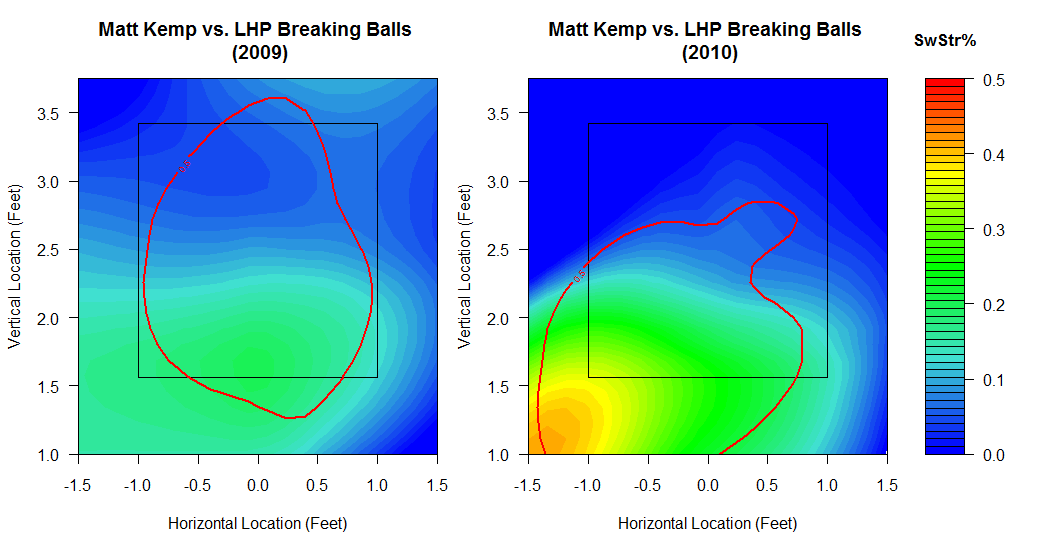
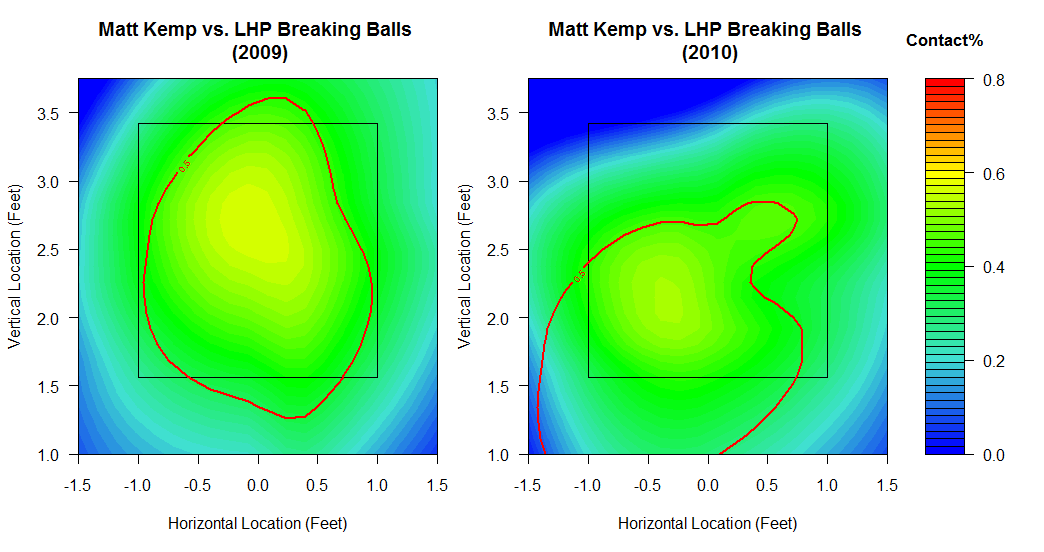
These show Kemp swinging at LHP breaking balls in the strikezone in 2009, but low and inside out of the zone in 2010 in his swing zones. As a result of chasing inside breaking balls, Kemp's SwStr% in 2010 in that lower inside corner has increased dramatically. This also shows in his Contact% plots, as the center of his contact hotspot has also shifted from the very middle of the zone toward the lower inside corner of the zone.
There's a lot of information in the previous 16(!) plots, but here are the Cliff Notes version of what I found about Matt Kemp this season compared to last season:
1) Swinging at less pitches (more walks), but whiffing more on hittable pitches (more K's)
2) Making less contact, but when he does make contact, he also puts the ball in play less
3) Swinging at (and missing) more high fastballs from RHP, resulting in less contact
4) Whiffing on LHP fastballs down the middle of the plate, making more contact on high LHP fastballs and less on down the middle LHP fastballs
5) Swinging at more inside RHP breaking balls and making less contact down the middle
6) Chasing low inside LHP breaking balls more, whiffing a LOT more, and making less contact down the middle
In general, what I present here is what we already know: Kemp is swinging and missing a lot more. But I hope that I was able to demonstrate clearly that Kemp is struggling against both fastballs and breaking balls, and I have shown where he is whiffing on them and where he is making less contact. Whereas Kensai looked at the "why," I'd like to say that I've taken an indepth look at the "how."
There could be plenty of reasons why Matt Kemp's whiffing behavior is so widespread, and this bolsters my belief that Kensai at Memories Of Kevin Malone is on to something with his post on the difference in Kemp's swinging mechanics. It's possible that Kemp started chasing inside sliders, high fastballs, and missing vulnerable pitches that he used to crush for independent reasons all at the same time, but I'm inclined to believe that a difference in mechanics (read Don Mattingly: and approach) is more likely to cause all of this simultaneously. And perhaps there is such a thing as being "too patient."
To evaluate if Kemp has changed his approach, I'd like to look at how Kemp's swinging behavior and outcomes have changed from last year based on count situation. Next time, I'll take a look at Kemp's tendencies and results on the first pitch, when the opposing pitcher is behind in the count (more balls), and when he's ahead in the count (more strikes).
Monday, August 30, 2010
Rivera's Cutters Working the Count
We know that Rivera has pinpoint control and likes to work the outer and inner edges of the strikezone against both right-handed batters and left-handed batters. We also know that Rivera is great at working the count, rarely getting to 3 balls in a count. Combining both of these ideas, can we figure out how Rivera works the count based on the locations of his cutters?
To do this, let's first look at Rivera's cutters by each count since 2007:
0-0: 218 to RHH, 343 to LHH
0-1: 105 to RHH, 188 to LHH
0-2: 57 to RHH, 42 to LHH
1-0: 80 to RHH, 101 to LHH
1-1: 86 to RHH, 108 to LHH
1-2: 60 to RHH, 55 to LHH
2-0: 24 to RHH, 28 to LHH
2-1: 41 to RHH, 37 to LHH
2-2: 47 to RHH, 53 to LHH
3-0: 2 to RHH, 4 to LHH
3-1: 4 to RHH, 4 to LHH
3-2: 15 to RHH, 19 to LHH
Note that these are cutters used in different pitch counts, not total pitches. Rivera does occasionally use two-seam and four-seam fastballs, and he has used traditional fastballs 16.2% of the time this season so far. However, a quick glance at the above list shows us that Rivera rarely falls behind in the count, or rarely uses his cutter when he has three balls. To analyze how Rivera works the strikezone based on the count, it wouldn't be sensible to do a 12-count plot of Rivera's cutters, as he's only thrown the cutter twice to RHH on 3-0 counts since 2007. Instead, let's combine the counts to different situations to see how Rivera locates his cutters as a result:
Count Situation (Not including full count)
On first pitch: 218 to RHH, 343 to LHH
Behind in the count: 151 to RHH, 174 to LHH
Ahead in the count: 222 to RHH, 285 to LHH
With two strikes: 164 to RHH, 150 to LHH
These sample sizes are much better for our plots and should allow us to accurately see how Rivera's cutters are located in different count situations. Let's take a first crack at Rivera's cutters against right-handed hitters on the first pitch and behind in the count along with the batter's swing zones and contact zones:
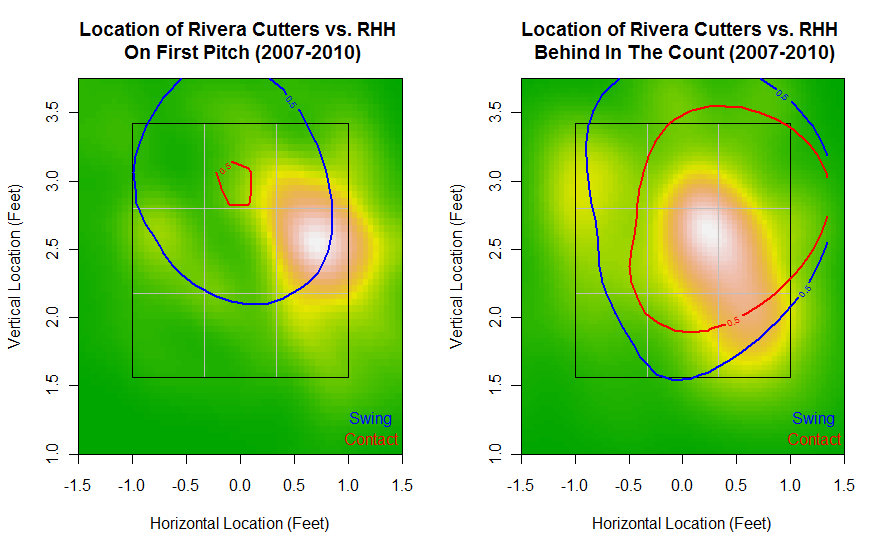
On Rivera's first pitch of the at-bat, he likes to throw a strike right away, hitting the outer edge of the zone against right-handed hitters, sometimes outside the zone. Hitters have a low contact rate on the first pitch, and when they do, they are better at making contact when Rivera's cutter is up in the zone. When Rivera is behind in the count, he still likes to get the outside edge of the strikezone, but this time looks to throw a pitch in the zone most of the time. Here, hitters make more contact off of where Rivera tends to throw, where the 50% swing and contact zones both encompass Rivera's hotspot. Note that there are shades of yellow on the inner parts of the zone as well, showing that Rivera does throw inside occasionally when he's behind in the count.
Let's look at the same count situations against left-handed hitters instead:
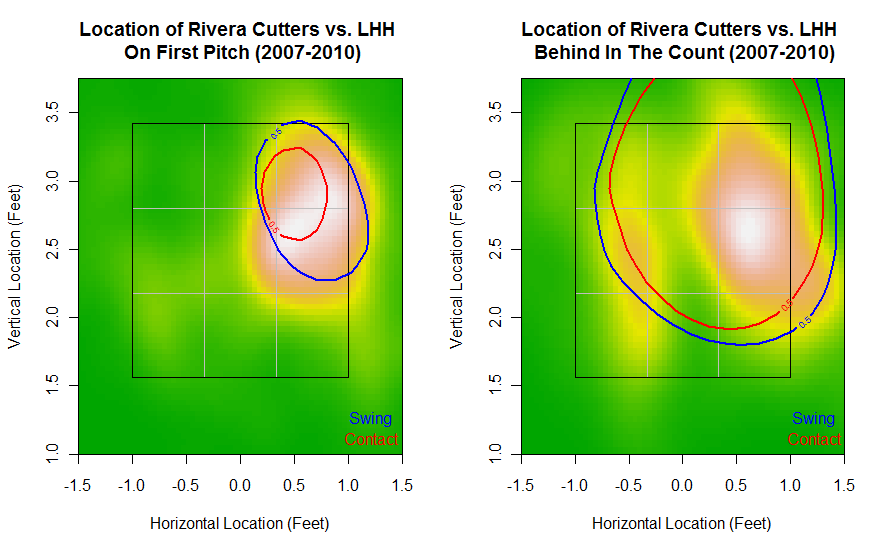
The first pitch to left-handed hitters is approximately the same location as against right-handed hitters, except Rivera locates up and inside in addition to middle inside. LHH have a much smaller swing zone on the first pitch compared to RHH. However, when they do swing, it is usually where Rivera locates his cutter most frequently. This is to say that Rivera's first pitch to LHH is likely to get swung at if it's placed in his hotspot. LHH also have a larger contact zone than RHH and it's located right in that hotspot, which means LHH make contact on the first pitch more often than RHH. Looking at cutters behind in the count to LHH, Rivera still likes that right edge, but locates to the left (outer edge for LHH) more often than to RHH (inner edge). He also goes inside and out of the zone on LHH in this situation more than he does going outside out of the zone to RHH.
What about his cutters to right-handed hitters ahead in the count and with two strikes? Let's take a look:
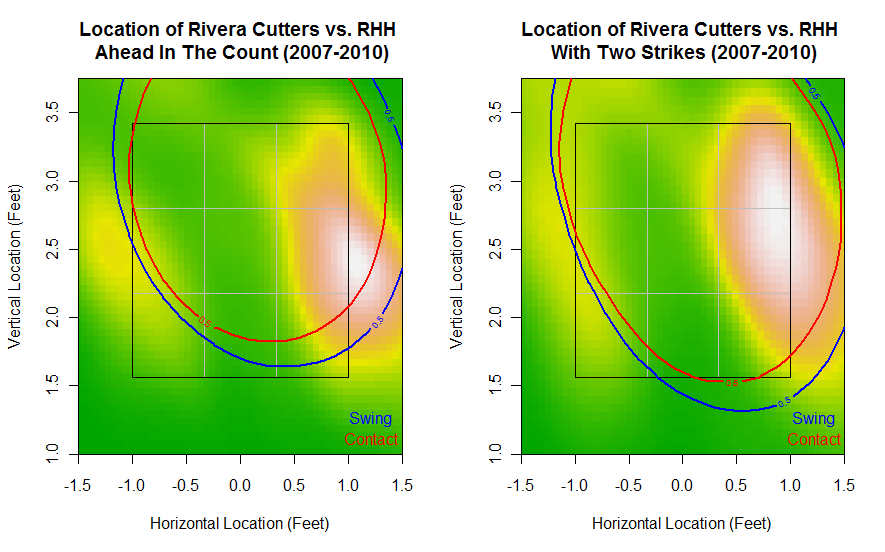
Here, Rivera goes outside the zone to RHH more often when he has the upper hand. He also locates inside to RHH sometimes too, but the epicenters of his main hotspot shifts to the right outside the zone when he's ahead in the count or with two strikes compared to when he's behind the count. It also seems as if batters swing more freely, swing zones that encompass much of the strikezone and outside as well.
Let's see if Rivera works left-handed hitters when he's ahead in the count the same way he works right-handed hitters:

Here's something different. Just as Rivera throws his cutters outside to LHH more often than inside to RHH when behind in the count, here we can see hotspots emerging on the left outer edge to LHH. When he's ahead in the count, Rivera works either edge, but goes inside and out of the zone quite often (Rivera's cutter moves in on LHH and away from RHH). On two strikes, it's pretty much anyone's guess whether Rivera wants to come outside and then barely hit the outer zone, or come into the zone and just hit the inside of the zone. The best bet for left-handers is to expect the outside cutter, as this count situation yields cutters in this location more than in other situations. Looking at the swing zones, LHH are pretty much swinging anywhere Rivera throws his cutter.
Finally, let's look at a table of different pitch outcomes and batter reactions based on the count situations we looked at above:

These are percentages of total pitches in those count situations, except for Whiff%. The distinction between SwStr% and Whiff% is that SwStr% is a % of total pitches while Whiff% is a % of total pitches swung at.
On the first pitch, RHH and LHH both swing less than 40% of the time, but LHH are definitely more successful at making contact and putting the ball in play. RHH whiff more in most count situations, but Rivera is able to get LHH to whiff more than RHH on two strikes. RHH put the ball in play 40% of the time when Rivera is behind in the count, but only 28.4% when ahead in the count. LHH put the ball in play about 35% of the time whether or not they are behind or ahead in the count.
To recap(itulate), it would appear that RHH are especially vulnerable on the first pitch, whiffing 28% of the time when they swing. RHH would hope to be behind in the count and expect a cutter inside the zone for their best chance of putting the ball in play. Otherwise, Rivera will paint the outer edge if he is ahead, pitching to the black, a difficult pitch to hit to say the least. For LHH, who make more contact off the right-handed Rivera than RHH, Rivera counters by working both edges of the zone. LHH still get whiff rates as high as 19.4%, and especially don't want to let Rivera get ahead in the count, as he will work either the outside edge or the inside edge.
Just looking at traditional statistics will appropriately show how dominant Rivera has been in his career, with a 2.21 ERA, 1.00 WHIP, .209 opponent's BA, and 1044 strikeouts in 1137+ innings. The plots and analysis above shows how he has achieved such success: by living on the black against both right-handed and left-handed hitters, and being able to consistently hit his various spots so that he gets hitters to swing at difficult pitches no matter the count.
Sunday, August 29, 2010
Cliff Lee's Four-Seamer, Curveball, Cutter, and Changeup
Which brings me to this post about Cliff Lee. Various sources (I looked at several articles, Fangraphs, and yes, Wikipedia) tell me that Lee throws five different pitches, armed with a four-seam fastball, a two-seam fastball, a cutter, a changeup, and a curveball. Plenty of past articles have detailed the faultiness and/or suggested better reclassification techniques of MLBAM's pitch type classification where all of the great PITCHf/x data comes from. I would preface this and my future posts with the knowledge that I will use MLBAM's pitch classification for now, as developing my own algorithm to determine a better classification seems like a time-consuming and daunting task to say the least.
But before I dive into plots of Cliff Lee's pitches, I need to look at his pitch types first according to MLBAM. Here's a list of the frequency of his pitches by handedness since 2007, according to MLBAM's classification and my database:
FA to R: 2016 pitches
FA to L: 885 pitches
FF to R: 1585 pitches
FF to L: 773 pitches
FC to R: 301 pitches
FC to L: 79 pitches
CH to R: 1237 pitches
CH to L: 80 pitches
CU to R: 490 pitches
CU to L: 286 pitches
SL to R: 222 pitches
SL to L: 384 pitches
Fangraphs's player page of Cliff Lee tells us that Lee rarely used his slider in recent years (less than 2% of his pitches) but uses his curveball much more. In the list above, the counts for SL (slider) and CU (curveball) are in the same range, so something is definitely fishy here. Fangraphs uses classifications from Baseball Info Solutions, so I am inclined to believe that if Lee does throw a slider, that he throws it rarely as opposed to almost as often as his curveball.
Now a very thorough study would include looking at the release points, spin deflection, and movements of Lee's sliders according to MLBAM to see if they were somehow misclassified as sliders when they were really curveballs that didn't break. I'm not going to do that in this post. Instead, I'll simply ignore the pitches that were classified as sliders and move on.
The same thing with FA (generic fastballs). These are presumably fastballs that could have been four-seamers or two-seamers, so in this analysis, I will ignore FA as well. Which means that I'll be leaving out two-seam fastballs.
Now that we've got that out of the way, let's look at location density plots of Cliff Lee's four-seam fastballs against RHH (1585 pitches) and LHH (773 pitches):
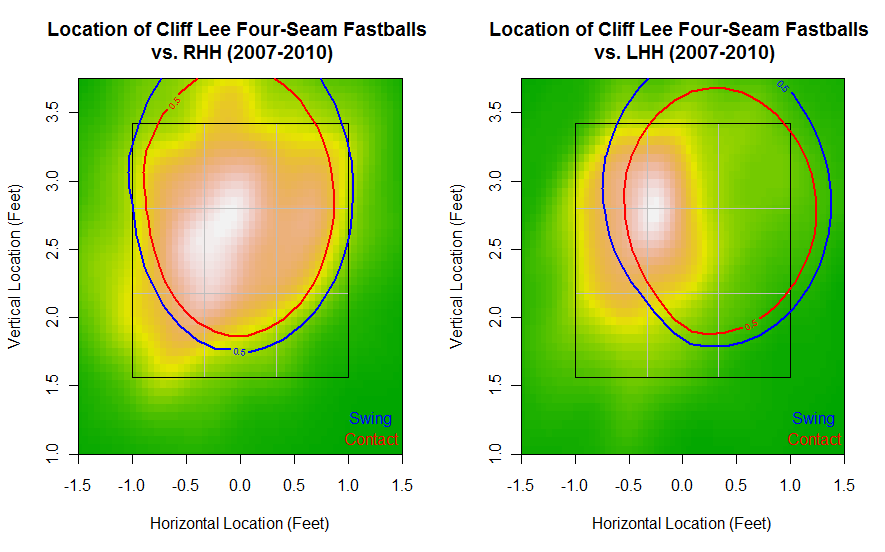
I've added contour lines indicating the area inside which the batter is 50% likely to swing at a pitch, as well as where the batter is 50% likely to make contact on a pitch (hopefully I did them right and interpret them correctly as well, feel free to correct me when you settle down from the PITCHf/x Summit, Jeremy). I also decided to use this color scheme because it contrasts well with the red and blue contour lines and also makes a yellowish contour line to show where Lee tends to locate his four-seam fastballs the most.
Here, Lee throws his four-seamer all over the zone against right-handed hitters, but throws them mostly to the outer (left) part of the zone against left-handed hitters. It would appear that Lee gets called strikes often in this area against LHH. This means that left-handed hitters are more likely to swing when the fastball comes up and inside and down the middle. Both RHH and LHH seem to make contact off of Lee's fastballs when they do swing, even when the four-seamer is up and out of the zone.
Here's a look at Cliff Lee's curveballs and opposing hitters' swing zones and contact zones (490 pitches to RHH, 286 pitches to LHH):
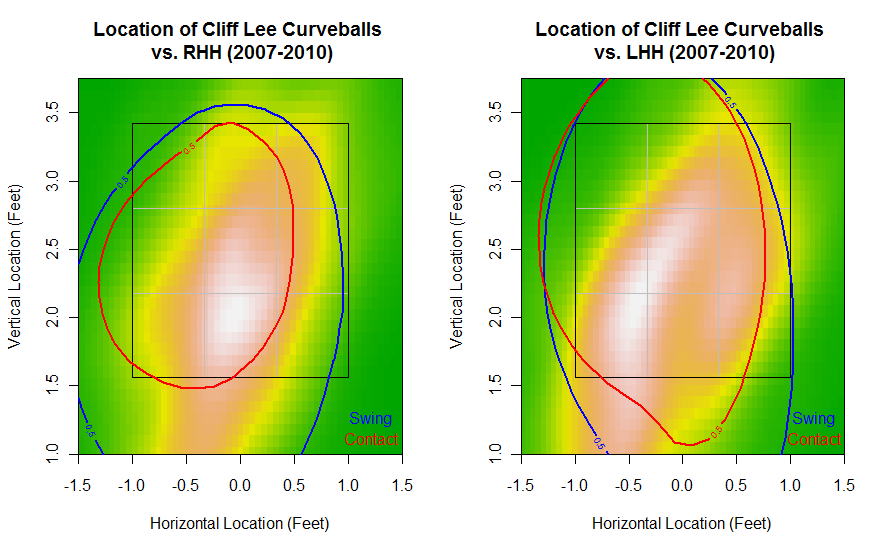
Lee distributes his curveballs very similarly against RHH and LHH, but hitters react differently depending on handedness. It would appear at first that LHH have the advantage by making more contact, but remember that these contour lines represent where the batter swings 50% of the time. This means that right-handed hitters are making better and solid contact in the sweet spots of the zone against Lee than left-handed hitters do, as the LHH 50% contact zone encompasses the upper and lower parts outside the zone. The RHH contact zone is much smaller than the RHH swing zone compared to the LHH contour lines, but that doesn't necessarily mean that RHH are getting more swinging strikes than LHH. Even if they did, making contact on low curveballs out of the zone usually results in a routine ground out. Basically, the larger the contact zone, the worse the contact being made, so the left-hander's curveballs are more successful against LHH than RHH, which is expected.
Finally, let's look at Cliff Lee's cutters (301 pitches) and his changeups (1237 pitches) against right-handed hitters (I'm not including cutters and changeups against LHH because Lee rarely throws these to them, less than 100 times for either since 2007):
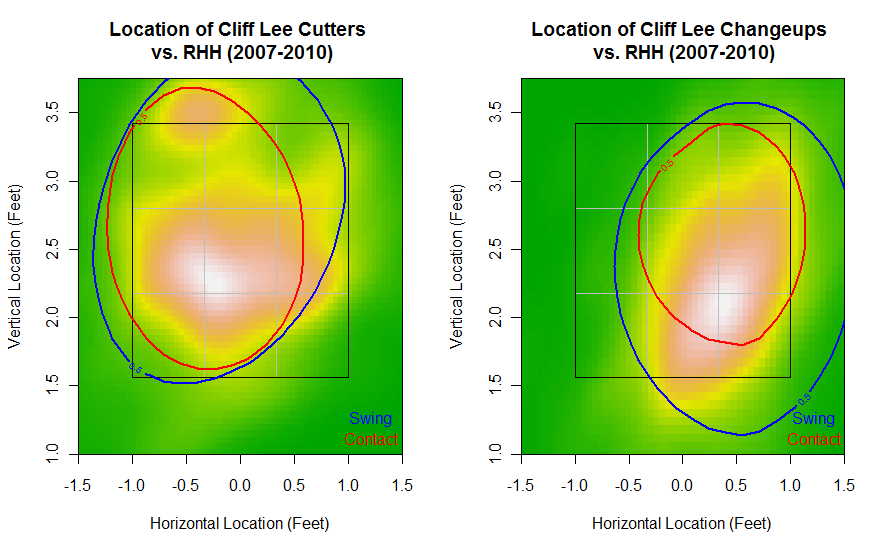
Lee likes to throw his cutter all over the middle parts of the zone against RHH, and interestingly likes to locate his changeups to the outer parts of the zone. What's interesting is that the contact zone is smaller against changeups than against cutters but the swing zones are about the same size, albeit in different locations. To me, this means that Lee is able to get more swinging strikes against RHH with changeups, a precondition being that the swing zones are similar-sized.
These plots are definitely interesting to look at and analyze, but they are also in a beta stage. I hope to make "visual scouting reports" like these in the future for both batters and pitchers, similar to what Jeremy Greenhouse did last year (to borrow his terminology). Having a good understanding of the relationship between the swing zone and contact zone will be important (and possibly even the swinging strike zone and balls in play zone). Hopefully I was able to interpret them correctly here, but I am ready to go back to the scatter plots to see if some of my analysis is confirmed there as well.
Saturday, August 28, 2010
Density Plots of Rivera's Cutters
Now I've learned quite a lot of interesting things since then, including a technique called kernel density estimation, a simple method to estimate the frequency/density of x,y coordinates. I wanted to take a look at Rivera's cutters again, this time in the form of pretty plots.
I've used hexagonal binning methods before to show Rivera's pitch movement plots, as well as filled contour loess regression plots for other players. Here's some plots of Rivera's cutters against RHH and LHH using bivariate kernel density estimation, a catalog of various colorful schemes:
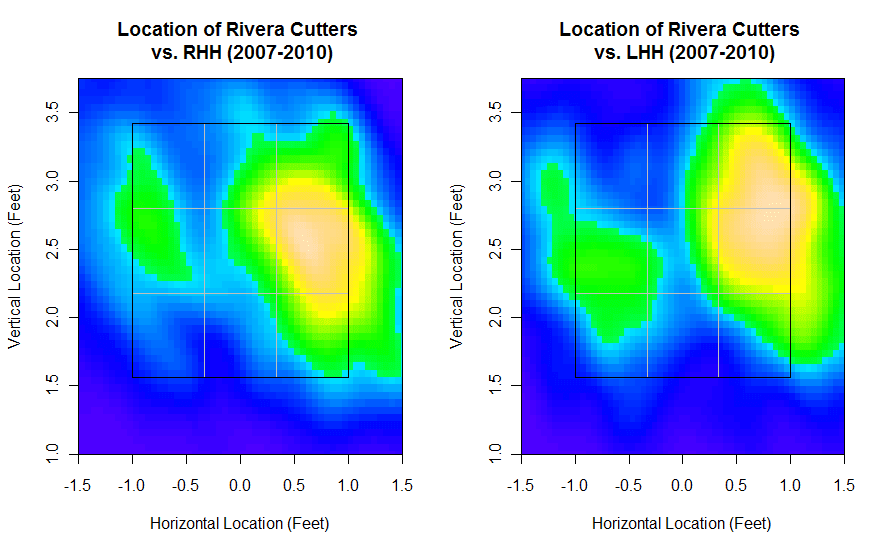
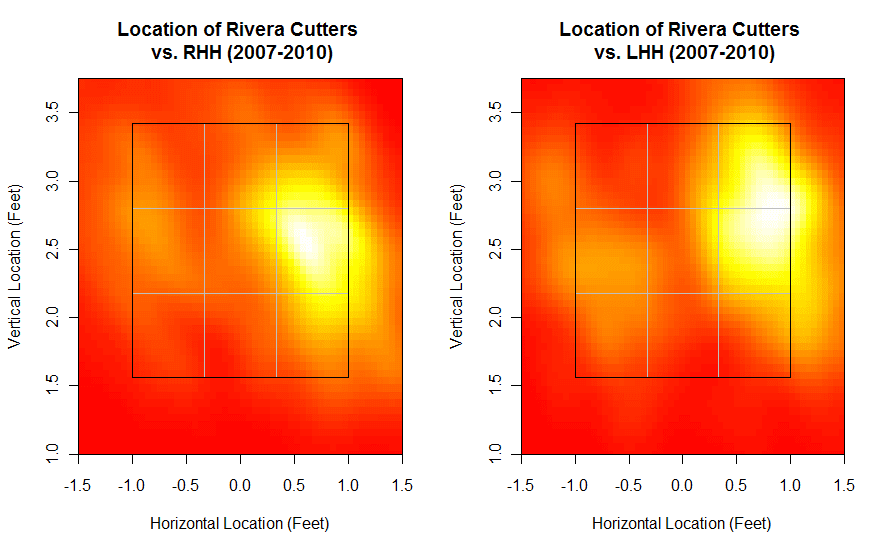
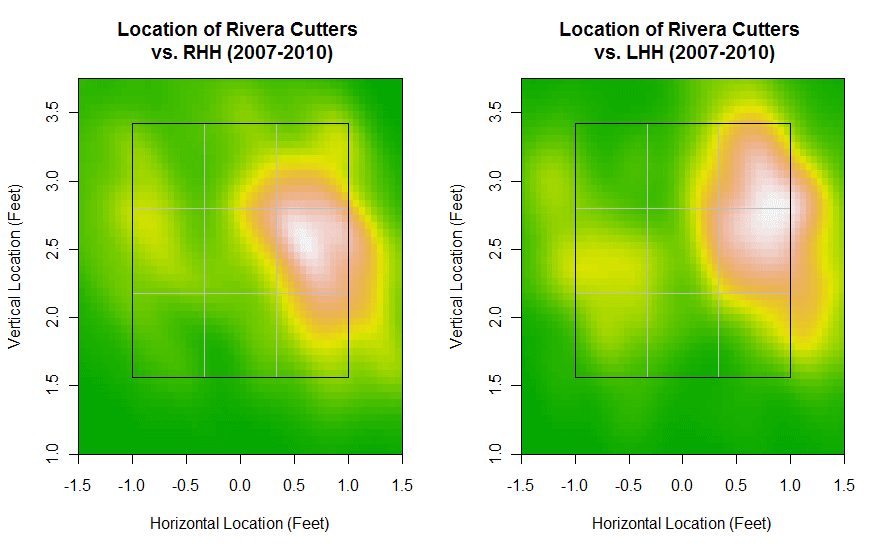
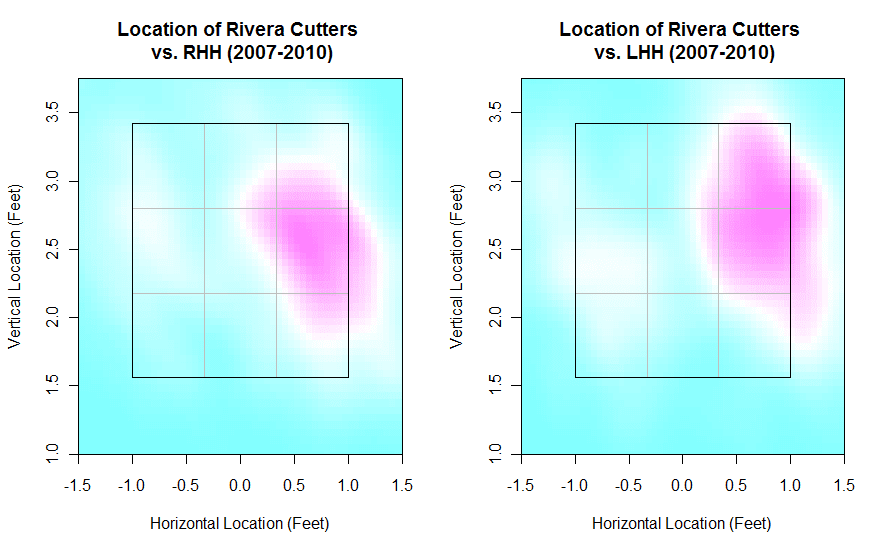
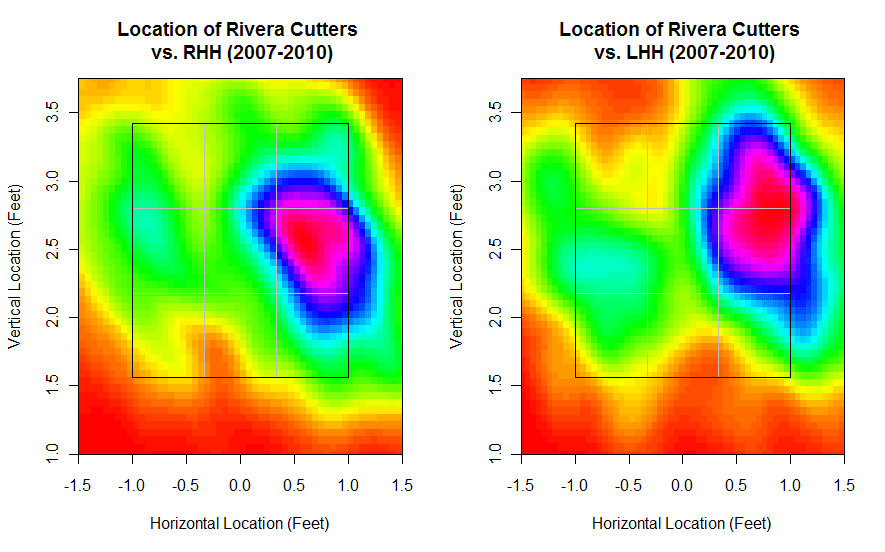
I've already talked extensively about how Rivera locates his cutters, but it's pretty clear that Rivera still has pinpoint control. Those are just a few of the possible color schemes I can use to display these density plots. The rainbow one in the last plot shows more levels of where Rivera locates his cutter. The second plot uses heat colors while the third plot uses terrain colors. Mind you, these are all plots of the same data, just different color schemes. I'll definitely make use of these density plots in the future (I've made them before for basketball shot locations) in order to show pitch locations and such. I'll probably keep the color schemes consistent though (I think the first plot is the best combination of contrast and color), but for now, these are definitely pretty to look at.
Friday, August 27, 2010
The Best and Worst Fastball Hitters
If you look at the leaderboard for the past three seasons combined, Albert Pujols, Kevin Youkilis, and Mark Teixeira come out on top as the best fastball hitters in the MLB. In the past three years, Pujols gained 121.6 runs above average against the fastball, while Youkilis and Teixeira gained 99.8 and 94.1 runs above average respectively.
A look at heat maps of run value against the fastball would give the best look at how these hitters fared against the heat. However, I wanted to create plots showing a measure that most readers will understand intuitively. Let's take a look at Pujols, Youkilis, and Teixeira in contact percentage against fastballs (percentage of fastballs they swung and made contact off of):
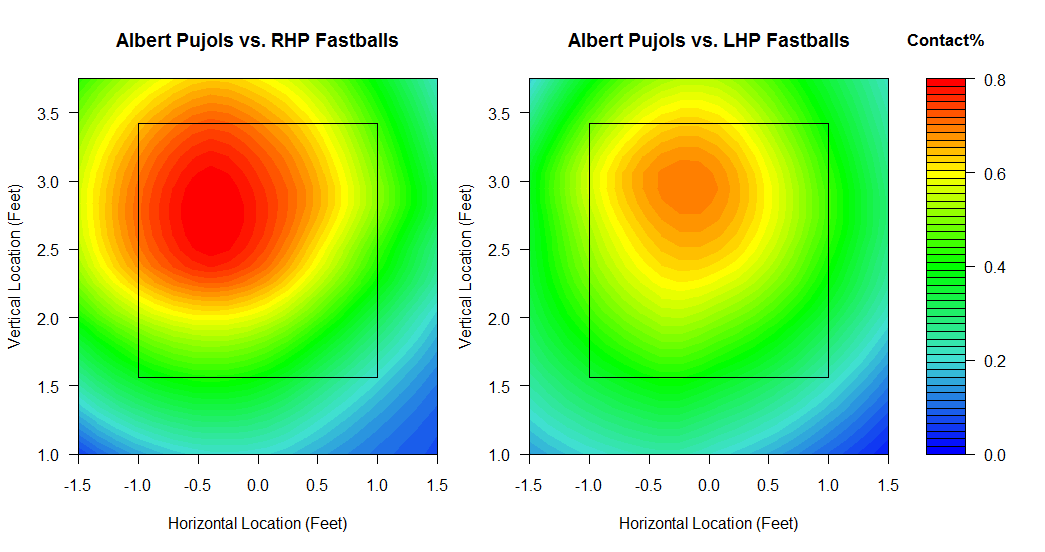
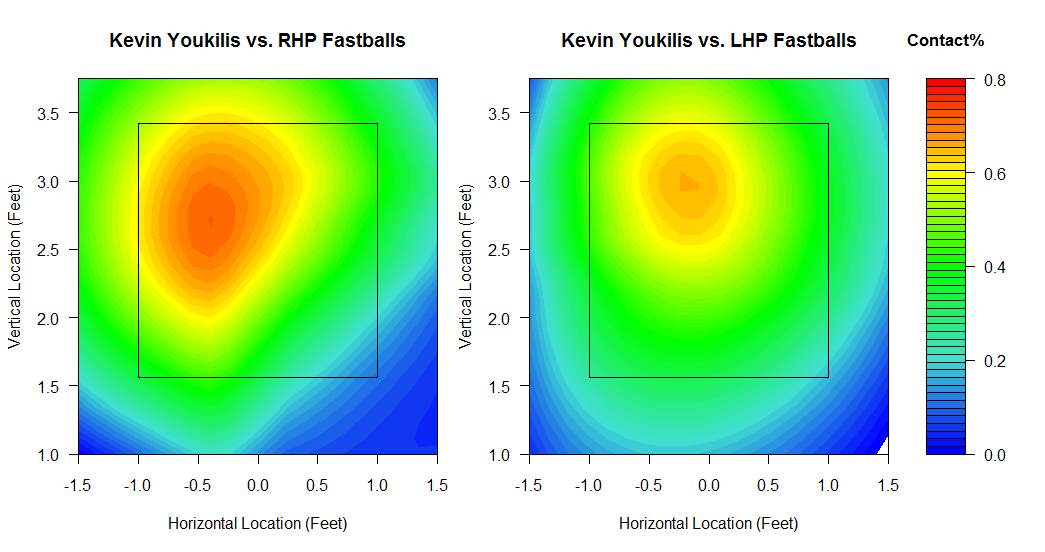
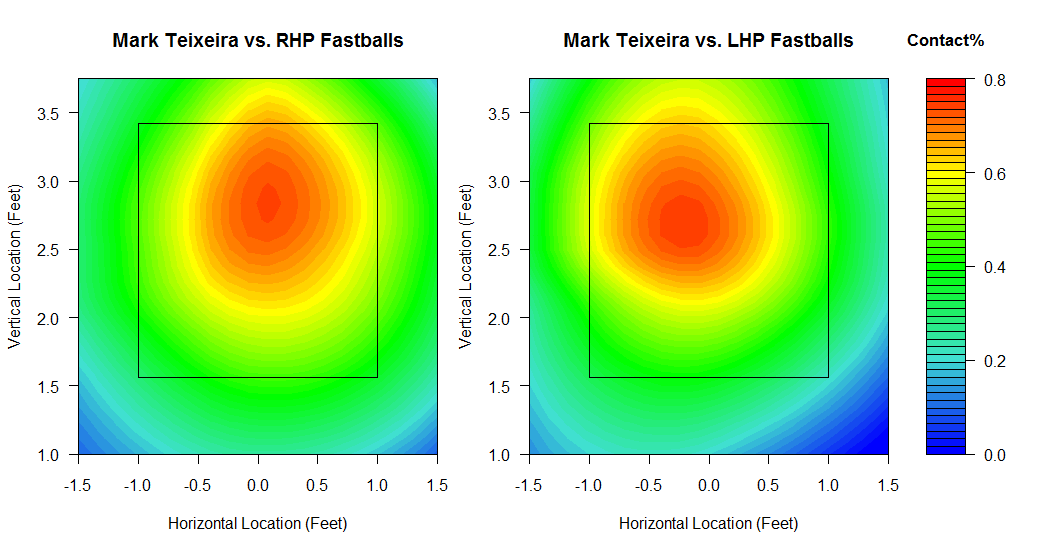
It looks like Pujols is by far better at making contact against fastballs from right-handed pitchers than the other two. Teixeira is a switch-hitter and it definitely shows in these plots, as he is the better hitter of the three against left-handed pitchers' fastballs. He makes contact on fastballs equally well against both RHP and LHP. Also, notice that the eye of the heat maps for all three hitters against LHP fastballs are relatively the same, but that Teixeira makes contact off of fastballs from RHP that are more to the right (outside for RHH) than Pujols or Youkilis, who make contact off RHP fastballs more inside. Again, this is because Teixeira is a switch-hitter while Pujols and Youkilis are exclusively right-handed. Whereas Pujols and Youk make contact in the left part of the zone against RHP, Teixeira bats left-handed against RHP instead, and so makes more contact in the right part of the zone.
Let's see how these guys' swinging strike percentages look against fastballs:
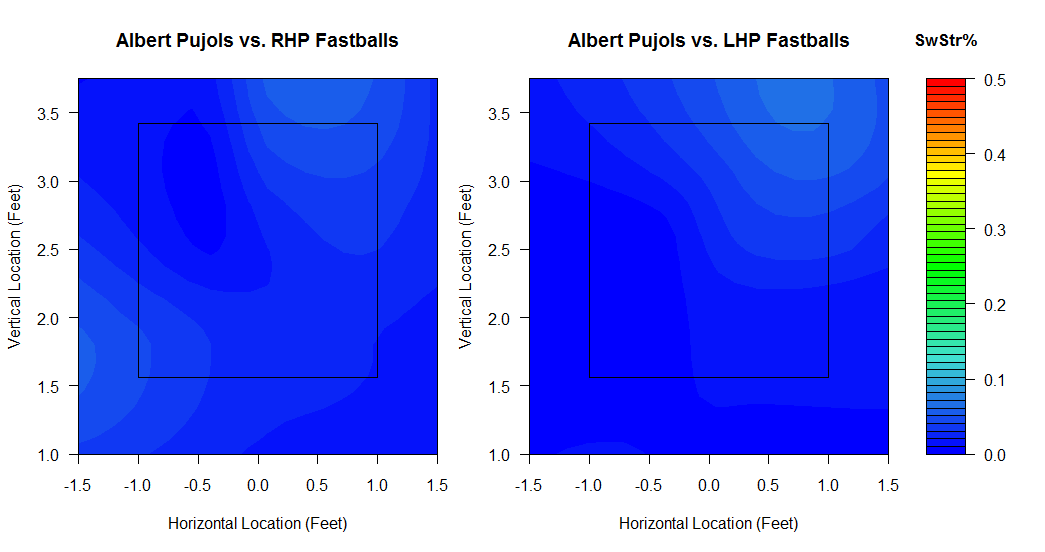
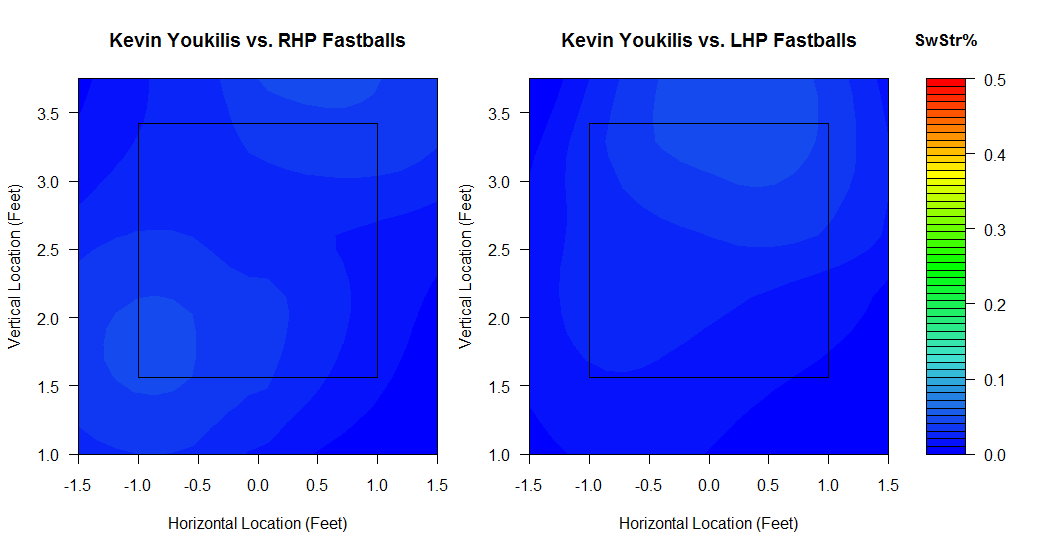
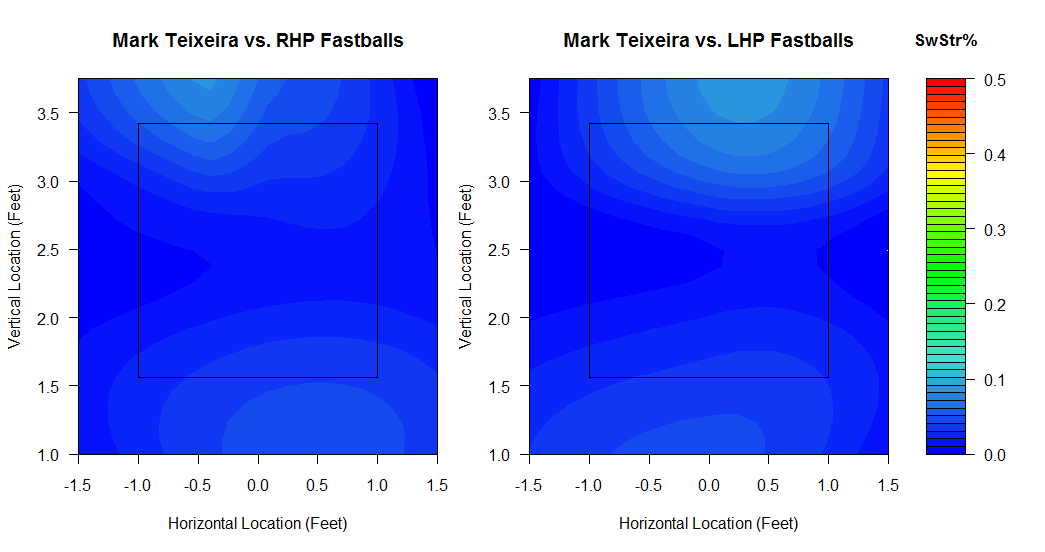
Remember that these are the best fastball hitters in the game today, so there's just blue all over in terms of swinging strikes. Looks like Pujols and Youk whiff a bit on high fastballs and inside fastballs from RHP, as well as high and outside fastballs from LHP. The switch-hitting Teixeira actually looks like he is more susceptible to swinging at low fastballs against both handed pitchers, but again, these swinging strike zones are very good compared to every other batter.
Now let's look back to the leaderboard to see the worst fastball hitters in the game according to Fangraphs. These turn out to be Jason Kendall, Yuniesky Betancourt, and Kurt Suzuki among qualified players, getting -40.5, -32.1, and -31.4 runs below average against fastballs respectively. Let's take a look at how they fared in terms of getting contact off fastballs:
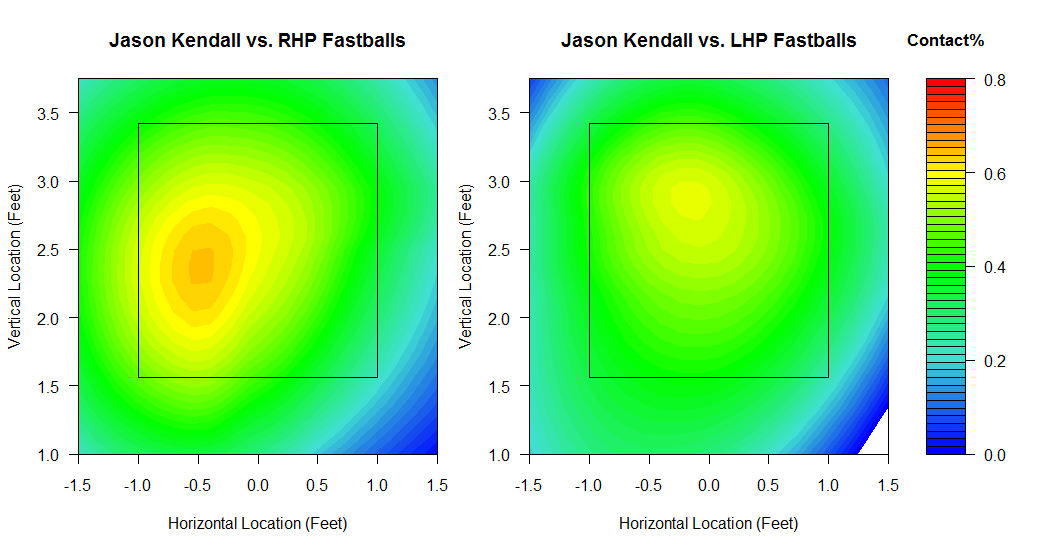
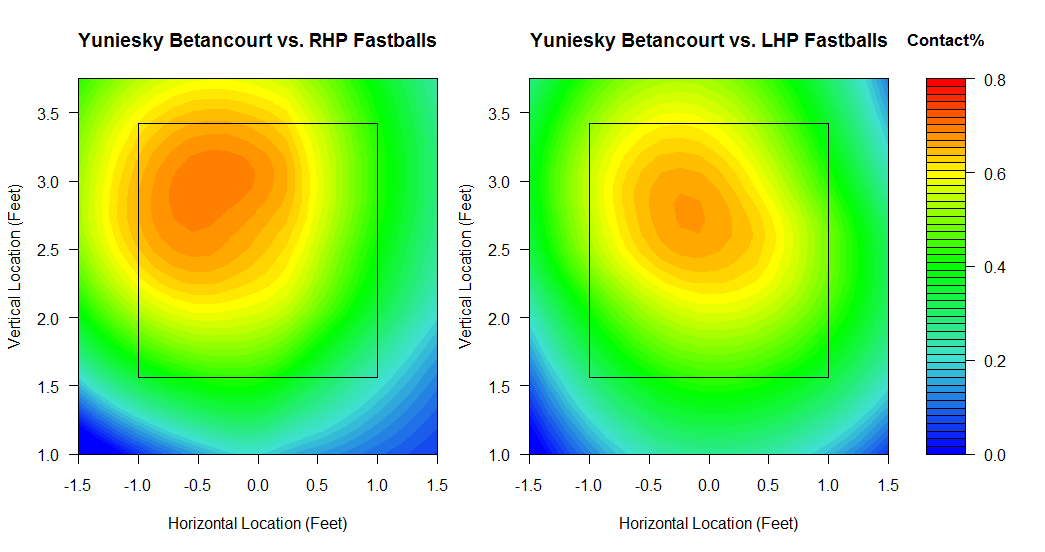
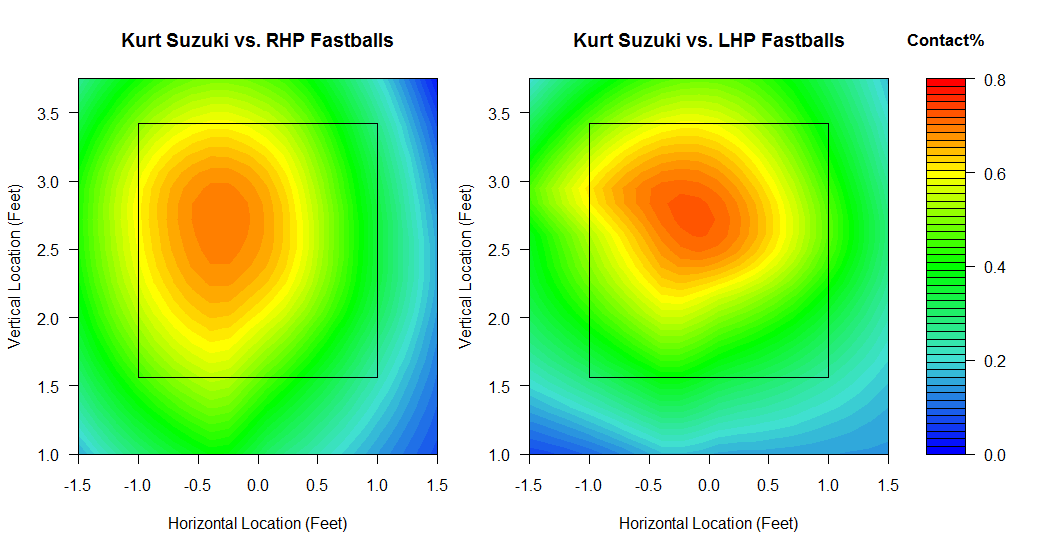
All right-handed hitters, these look different from the Pujols/Youk/Teixeira plots earlier. The one that stands out the most is definitely Jason Kendall, who just can't seem to make contact off of fastballs, especially from LHP, barely making contact 50% of the time when the fastball is right down the middle of the plate. Betancourt can make some contact off of RHP fastballs while Suzuki has a decent epicenter against LHP fastballs, but bear in mind that contact doesn't necessarily entail that they're making good contact. Fastballs are arguably the easiest pitch in the game to get contact off of, and the best hitters can get around fast enough to make solid contact. Pujols/Youk/Teixeira make a lot of contact, but also get wood on the ball, all three being some of the top power hitters in the game, presumably getting most of their success off fastballs.
Let's take a look at how the worst fastball hitters fared in swinging strike percentages against fastballs:
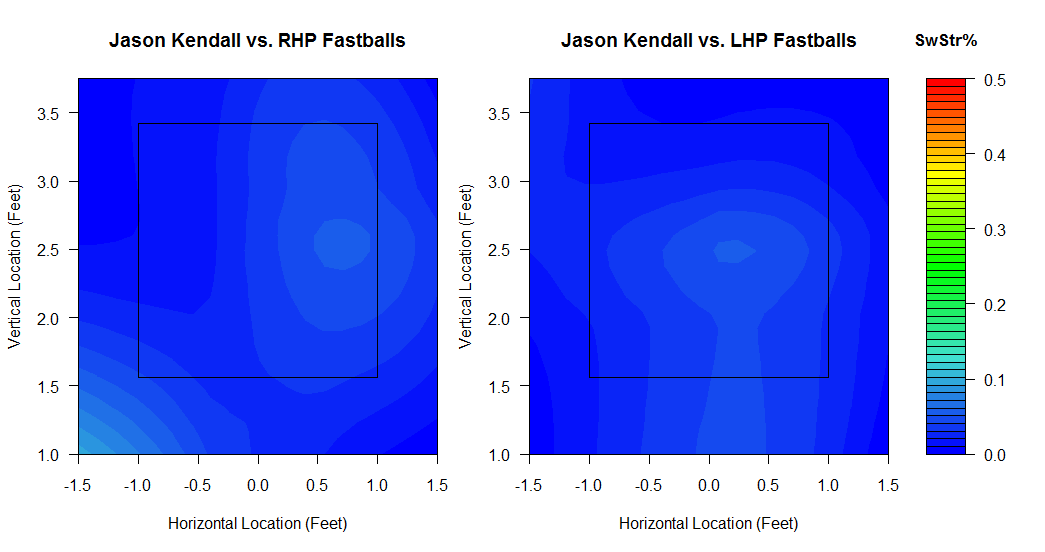
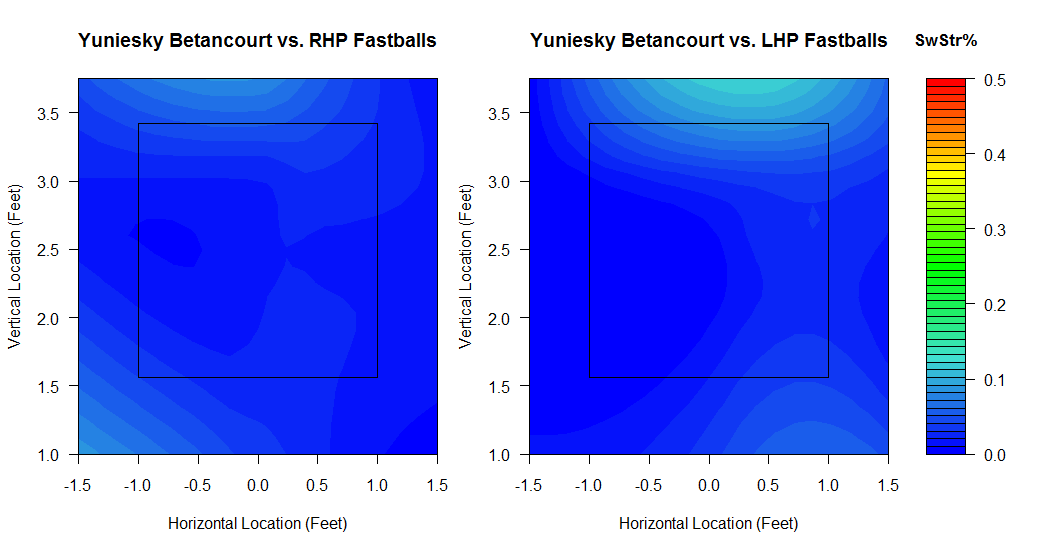
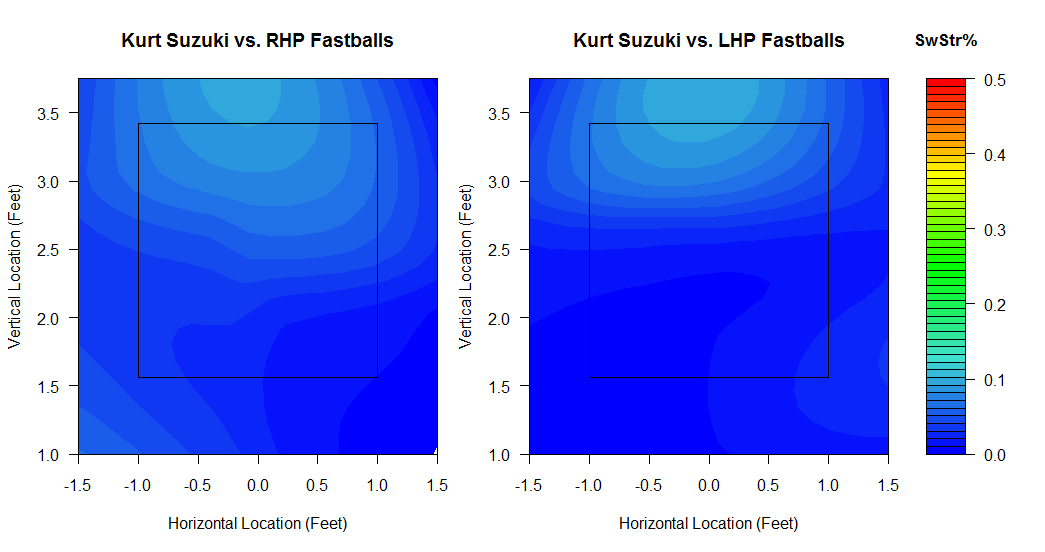
It looks like part of the reason that Kendall can't make contact off fastballs down the middle of the plate is because he keeps missing them, as you see some lighter blue in swinging strikes down the middle as well as low and inside against RHP. This is different from both Betancourt and Suzuki, who swing and miss at high fastballs out of the zone, where Betancourt is particularly vulnerable against high LHP fastballs and low and inside RHP fastballs.
Admittedly, there are better plots to make in order to capture the effectiveness and ineffectiveness of hitters against certain pitch types. Plots I may experiment with in later posts will almost certainly include slugging percentage per balls in play (SLGBIP as opposed to BABIP) to show how much power the best hitters against a certain pitch get per ball they put in play.
But for now, these plots of contact percentage and swinging strike percentage clearly show who are the better and worse of the fastball hitters among these six. I did keep the swinging strike percentage plots at a lower maximum (which is why you see all the shades of blue) because fastballs typically induce the least amount of swinging strikes compared to other pitches (especially changeups). This will allow you to compare the best and worst hitters in terms of contact% and swinging strike% later between different pitch types if I do other posts for other pitches, as the color scales will remain the same to allow for a fair comparison.
Thursday, August 26, 2010
Is the Strike Zone Bigger in August?
I wanted to see this for myself using my own method, so I created a called strike probability model for April 2008 vs. August 2008, April 2009 vs. August 2009, and April 2010 vs. August 2010. What I did was I pulled all called strikes and balls (ignoring all the times when the batter swings) within half a foot from the rule book strikezone, half a foot inside and half a foot outside. I then modeled a surface fit for all called strikes over pitches where the batter didn't swing. I assumed that the middle of the inner 0.5 foot border returned called strikes 100% of the time if the model did not project that far inward, and same with balls way outside the strikezone.
Let's take a look at called strikes in April 2008 vs. August 2008 to see if umpires called more strikes as the season went on in the past, where red indicates called strikes and blue indicates balls (blue balls, snicker). Note that I split the strikezone into nine equal-sized boxes for reference, while the outer border is the approximate rule book strikezone:
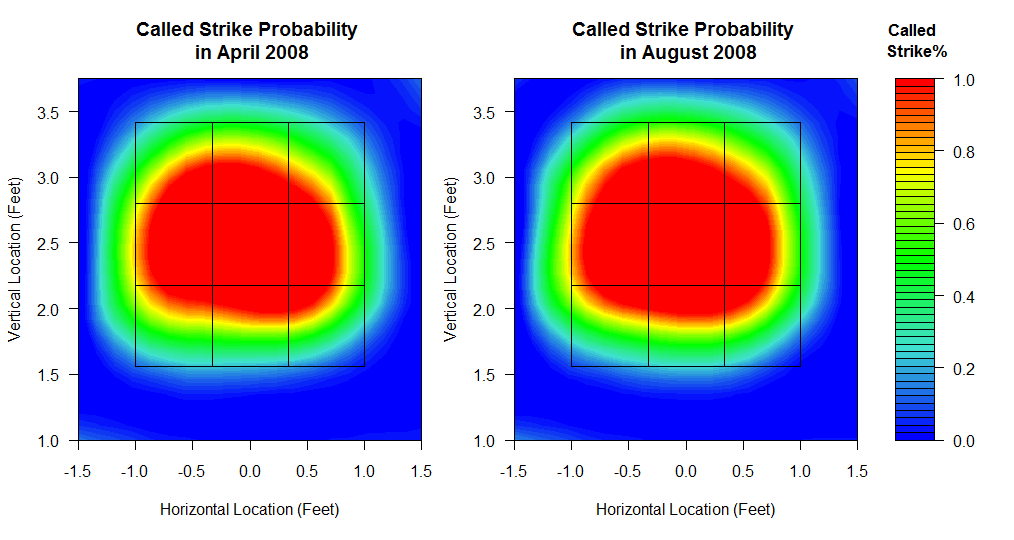
It looks like here that the left-right distance is not affected much, but you can see that the upper areas as well as the lower areas show more called strikes in August, if only slightly bulging. Let's take a look at April 2009 vs. August 2009:
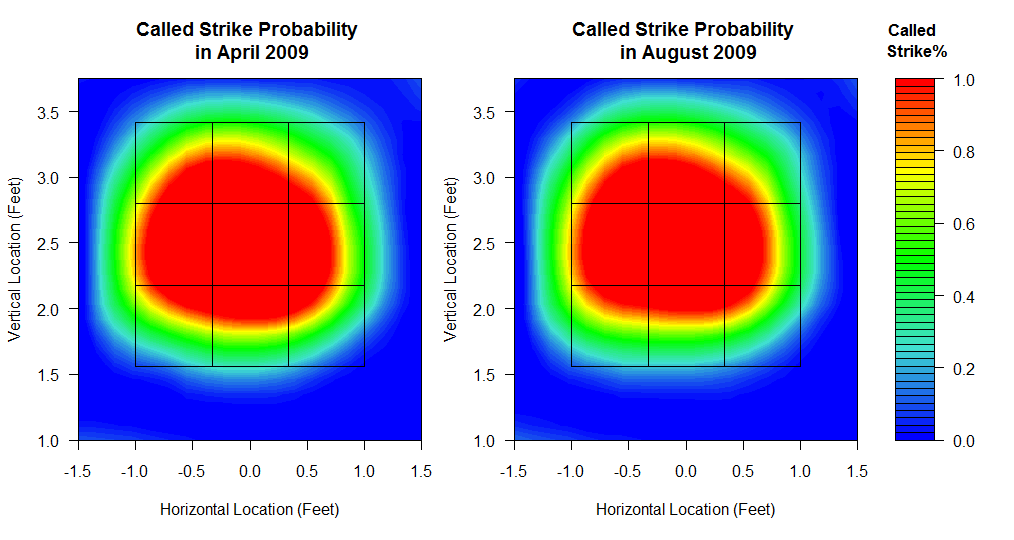
Here, it actually looks like April had a higher probability of called strikes in the lower part of the strikezone. There isn't that much change in 2009 though compared to 2008. Now let's compare this year's April vs. the current month of August:
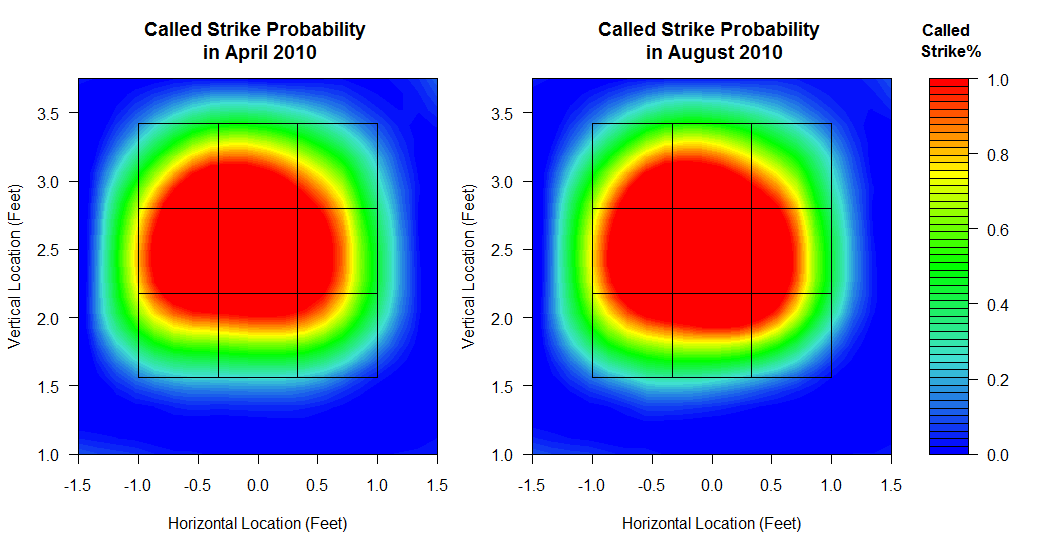
Is Ortiz on to something? At first, I wasn't so sure. Using the grid as reference, you can notice the red extend upwards slightly and downwards a bit more, but it didn't see like much of a difference to me. I'd have to show the numbers to back it up, as the difference in the images produced didn't seem significant enough to me. In the end, the numbers over at Zimmerman's post may well back Ortiz's claims, showing an increase in called strikes per non-swinging pitches increasing from 51.0% in April this year to 53.5% this month of August. That difference of 2.5% could very well be captured by that red dip you see in the lower third quadrants.
How much does this affect each individual batter? There were 55,240 total called strikes and balls in April. Assuming the month of August would have a similar number, that's 1381 balls converted to called strikes, 2.5% of 55,240. A quick query tells me that there were 21,191 total atbats in April, which would mean that approximately 6.5% of all at-bats in the month of August had one more called strike than in April.
Crude calculations there, but it looks like that David Ortiz might be right and that the umpires have expanded the strikezone as a whole, if only a little bit. Probably means that Ortiz had an atbat among the 6.5% of unfortunate souls who were disadvantaged by one less call in favor of the batter.
Wednesday, August 25, 2010
Ryan Howard's Whiffs by Pitch Type
Ryan Howard has been either second or third in the entire MLB in swinging strike percentage and other strikeout categories since Mark Reynolds' debut in 2007. Fangraphs' stats tell us that Howard has swung and missed on 14.6% of pitches so far in 2010 while posting a swinging strike percentage consistently above 15% in the previous three seasons. Like Reynolds, Howard doesn't actually swing at everything compared to other swing-happy batters, swinging at less than 50% of pitches every season for his career.
Again, I'm going to leave out cutters and just look at four-seam fastballs, sliders, curveballs, and changeups due to sample size. Let's look at four-seam fastballs (987 pitches from RHP, 649 pitches from LHP):
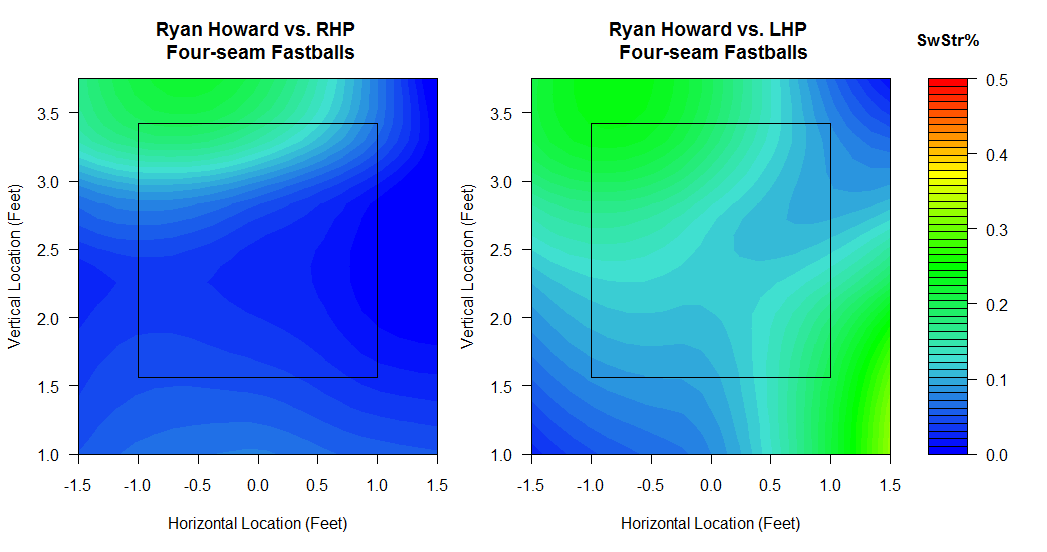
It seems like Howard lets off the high fastball more than Reynolds does (or makes more contact), keeping his whiff rate below 30% against fastballs while Reynolds reached the 40% range. But just as Reynolds falls victim to low and inside fastballs from right-handed pitchers occasionally, Howard whiffs at low and inside fastballs from left-handed pitchers. Take another look at Reynolds' four-seam fastball whiff plots and notice the symmetry based on handedness compared to Howard's.
Here's a look at Howard against sliders (892 from RHP, 817 from LHP):
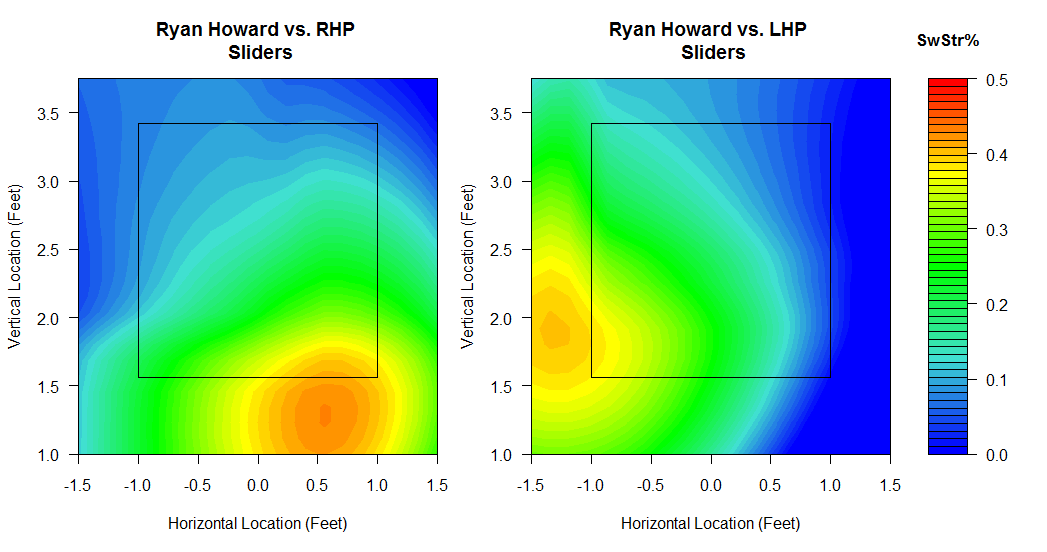
Looking at Reynolds' whiff rates against sliders, there's that symmetry again, but for both batters, it seems as if the opposite handed pitcher is more successful at getting either batter to whiff on sliders, which suggests that one way a pitcher can counter an opposite-handed batter's platoon advantage is to throw low and inside sliders. Of course, that's based on a sample size of the two most whiff-prone hitters in the MLB, so take that suggestion with a grain of salt.
Let's look at Howard against curveballs (675 from RHP, 518 from LHP):
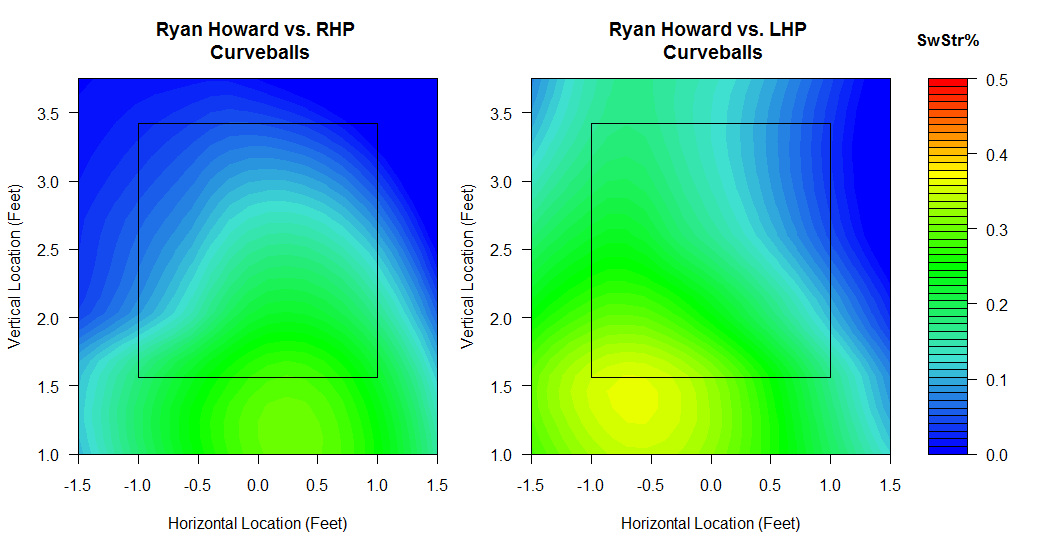
These look similar to that of Reynolds, except that Howard swings and misses on curveballs more from LHP while Reynolds whiffs on curveballs from RHP, again, because of the opposite handedness.
Finally, and this is good, let's see if Ryan Howard falls victim to changeups the same way that Mark Reynolds does (982 from RHP, 274 from LHP):
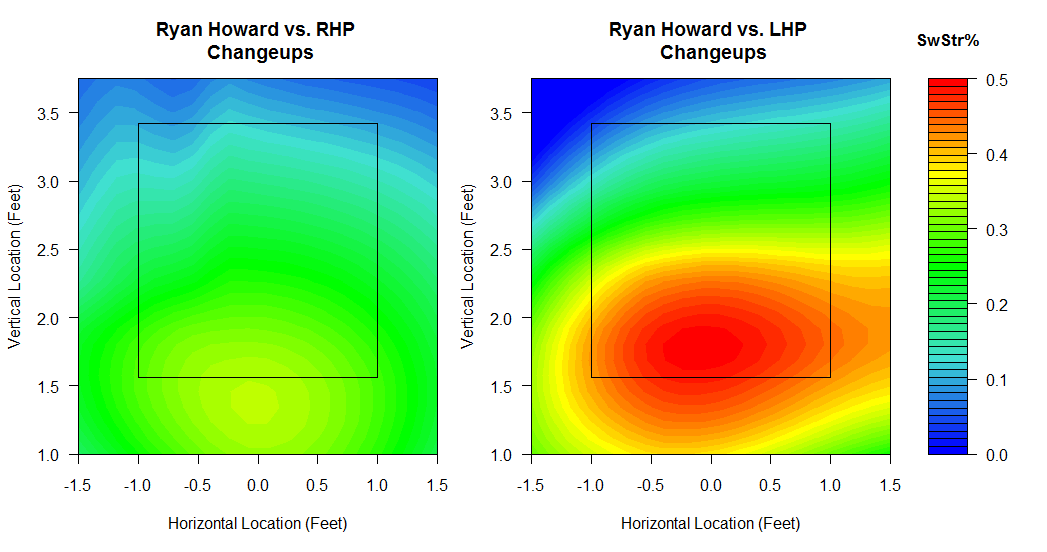
Now this is telling (I'll eventually find and use another adjective to describe my amazement at a discovery). Howard swings and misses at over 30% of changeups in nearly all parts within the strikezone while he is particularly weak against low changeups from left-handed hitters at over 40% whiff rate, just like Reynolds' weakness against RHP changeups.
Maybe it's just coincidence that two power hitters with the highest whiff rates, one right-handed and the other left-handed, are weakest against same-handed changeups all over the strikezone but particularly low around the knees. Either way, it's definitely interesting to realize the main weaknesses of Reynolds and Howard. I'd imagine that knowing where to throw a certain pitch and being able to combine them effectively will get Reynolds and/or Howard to continue whiffing at a high rate. I'd also imagine that the difference between a deceptively low and inside slider and a hanging one is minuscule, even for a major league pitcher, just as a high fastball out of the zone could just as easily go down the middle of the plate. Of course, those are the types of pitches that both Reynolds and Howard can and routinely do crush out of the ballpark. To confirm that, we'll have to look at slugging percentage by pitch type another time.
Tuesday, August 24, 2010
Mark Reynolds' Whiffs by Pitch Type
This year, he leads the league once again in strikeouts, as well as perennial leader in swinging strike percentage. He has whiffed on 17.3% of all pitches this season, second place being Ryan Howard at 14.4%. Interestingly, Reynolds does not actually swing at everything a la Jeff Francoeur (60.7% swing percentage) and is barely in the top 50 in percentage of pitches he swings at with 46.8%. This makes it even more amazing that Reynolds leads the league in strikeouts and swinging strike percentage regularly without even taking that many swings. That's a lot of whiffing going on, and I do suppose that the rare times he does connect the bat to the ball, he hits it hard.
I wanted to know more about Mark Reynolds' swinging strike percentages to see how he fares against certain pitch types by handedness. Of the five main pitch types, fastballs, sliders, cutters, curveballs, and changeups, Mark Reynolds has seen cutters less than 200 times since his debut, 139 cutters from right-handed pitchers and 41 cutters from left-handed pitchers. He has seen at least 200 pitches for the other pitch types for right-handed pitchers or left-handed pitchers. Ignoring cutters due to small sample size, I will take a look at Reynolds' swinging strike percentages against four-seam fastballs, sliders, curveballs, and changeups.
Let's take a look at Mark Reynolds' swinging strike percentages against four-seam fastballs split by RHP and LHP (1435 pitches from RHP, 468 pitches from LHP):
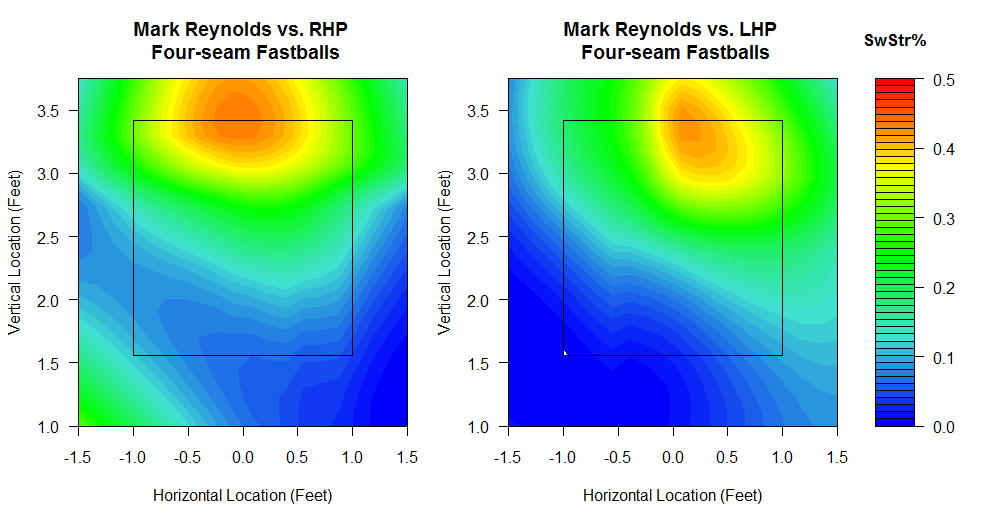
Here, it looks like Reynolds falls victim to high fastballs from both right-handers and left-handers. For Reynolds, he whiffs on the outside fastball from LHP stick out as well as the low and inside fastball from RHP.
Here's a look at Reynolds against sliders (1542 from RHP, 224 from LHP):
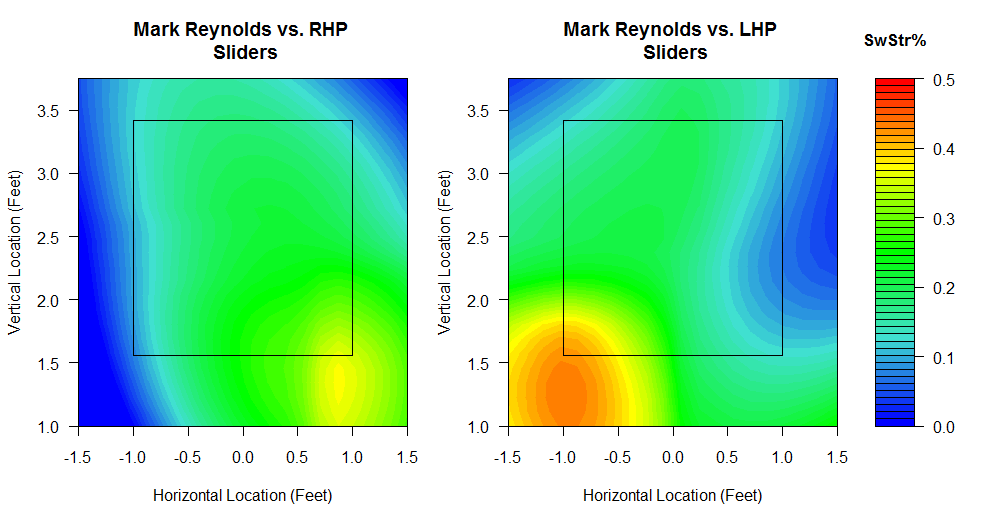
This is interesting. Reynolds strikes out far more against right-handed pitchers than against left-handed pitchers, but he tends to swing at (and miss) sliders coming from LHP more than he does from RHP. LHP sliders come low and inside while RHP sliders go low and outside, but even LHP sliders coming in from low and outside are swung at and missed by Reynolds.
Curveballs against Reynolds are a whole different story (567 from RHP, 228 from LHP):
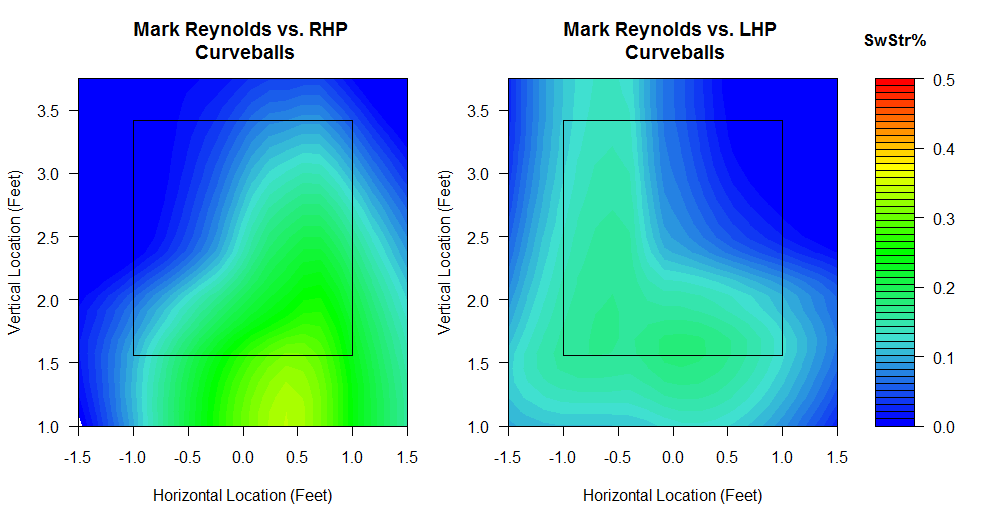
Here, Reynolds clearly struggles at connecting on curveballs from right-handed pitchers, some in the strikezone and most low and outside the strikezone. Curveballs from LHP also get Reynolds to whiff sometimes on the inside part of the plate as well as the lower part.
Finally, here's a look at Reynolds against changeups, which look like his greatest weakness when it comes to missing pitches (430 from RHP, 338 from LHP):
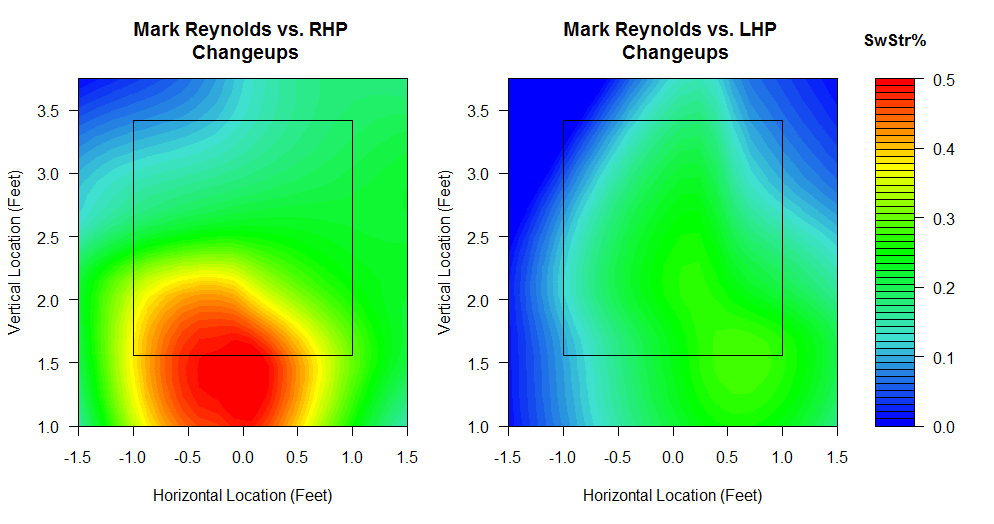
This is very telling. The splits against changeups are very different, as Reynolds whiffs on over 50% of changeups from right-handers that are located on the edge of the strikezone at the bottom. This is much different from LHP changeups, where any spot doesn't look to cross over 30% whiff rate, except the lower righthand corner of the zone. What's also crazy about this is that when you look at Reynolds against changeups in general, he misses at around 20% of nearly all changeups low outside and nearly all areas within the strikezone as well.
From these plots, there are characteristics of Reynolds' swinging strikes that are similar to conventional thought and common knowledge, such as chasing high fastballs or low breaking balls. But the key to exploiting Reynolds' weakness at missing the ball when swinging is definitely throwing timely changeups, especially from right-handed pitchers, while it seems that Reynolds is less prone to whiff against LHP curveballs the most.
Subscribe to:
Posts (Atom)