Using a macro that I found via Google called "Merge CSV files," I was able to combine all of the play-by-play data in single spreadsheets, one for each of the four seasons that Basketball Geek has available.
I then filtered each of the spreadsheets by etype, and chose shot, in order to return all plays in each season that were shots. I took each of these filtered datasets combined them into a fifth Excel file to list all shots that happened in the past four regular seasons of the NBA (turns out to be 763,444 shots, which unfortunately does not agree with Basketball-Reference.com's 796,617 shots, something that I will ignore for now due to the sheer amount of entries here).
This shots data has everything from players on the court at the time, who the assist went to, who blocked the shot if it was, the result (made or missed) type of shot (ranging from 3pt to driving layup to pullup jumper to running bank shot), and, get this, the X and Y coordinates of each shot. And with a general knowledge of filter and pivot tables and the like, I've come up with a lot of interesting findings.
Using the same data that I've compiled, Jeremy Greenhouse over at The Baseball Analysts was able to chart visualizations of shot locations. I decided to give this a try myself, knowing a little bit of R from class.
With the help of Jeff Zimmerman's Advanced Graphing Techniques series over at Beyond the Box Score, I was able to write the R code to map contours and heat maps based on data.
Here's some of the preliminary images I came up with (without axes labels and titles, mind you. I've just tried these last night, and this is my first look):
Carmelo Anthony Shot Location Frequency (2006-2010)

Danny Granger Shot Location Frequency (2006-2010)
 Dirk Nowitzki Shot Location Frequency (2006-2010)
Dwyane Wade Shot Location Frequency (2006-2010)

Kobe Bryant Shot Location Frequency (2006-2010)

LeBron James Shot Location Frequency (2006-2010)
 Tim Duncan Shot Location Frequency (2006-2010)
NBA Shot Location Frequency (2006-2010)

NBA Shot Location Heat Map and Expected Points per Shot (2006-2010)
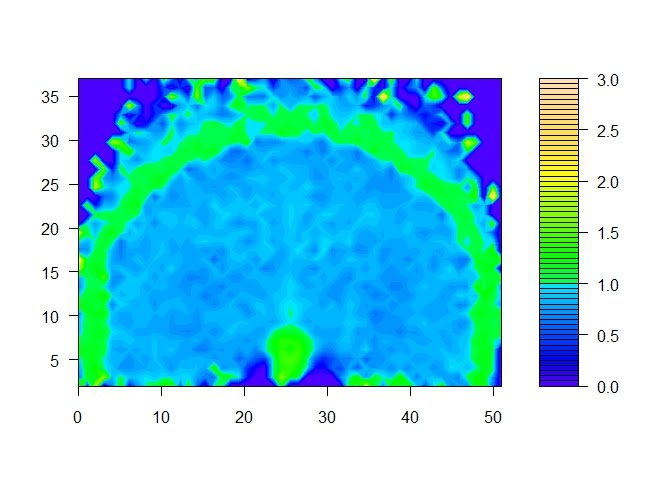 Please note that the scales are all off (except the last one) so you probably shouldn't compare the colors between player graphs (the color palette scale actually refers to a raw count of number of shots taken, so it's not standardized by minutes played or whatever. The last one refers to expected points per shot that I calculated). The X and Y axes are in feet, so consider that the center of the basket is at coordinates (25, 5.25).
However, you can definitely make sense of the graphs and tell the tendency of where some of these superstars/stars tend to shoot. Carmelo and D-Wade fans know that they love their hot spots, and these graphs confirm their tendencies. Dirk and Kobe basically can shoot anywhere on the court, while Granger loves to go at rim or take 3s not on the baseline. Tim Duncan is your classic post-up player, so he hangs out near the bottom of his frequency graph there.
Some things to add on to these graphs when I make them in the future:
- title and xlabel and ylabel and etc.
- Superimposed outline of 3 pt line and key lines and etc.
- Legend for made and missed shots possibly?
And other graphs to take a look at in the future:
- Some way to standardize shot location frequency scale (shot percentage? as a fraction of total NBA shots in that location? or as compared to the league average tendencies?)
- Home vs. Away splits
- 1st, 2nd, 3rd, 4th quarters, last two minutes of regulation + overtime
- Field goal % and effective field goal %
- Expected points per shot for players (are players taking shots where they are successful at?)
- Types of shots, by NBA and by player
- Assisted shots (Nash-assisted shot locations, NBA assisted shot locations)
- Offensive rebound locations (need X-Y coordinates of shot in previous play before offensive rebound)
- Any additional suggestions
Anyway, I have a short rest of the summer ahead of me to generate more of these graphs and take a look at some of these in greater detail. There's definitely a lot more stuff and analysis to do with a huge database of NBA play-by-play data categorized by a lot (but not everything). But right now, generating heat maps and these visualizations interest me the most. Should be fun.
wow yay kobe's the best :D
ReplyDelete